Is there a way to compute metrics in a range of docs? I've heard that timelion has got a feature like this but I would like to get a table as a visualisation result.
Not possible in core Kibana at the moment. You would need support for the bucket script aggregation. You might be able to achieve what you want with TSVB. A table visualization was added to it in version 6.1 of Kibana.
Hi @Bargs,
I'm a little bit confused, Is the „Bucket Script Aggregation“ just part of the Time Series Visual Builder or can I use it in 6.1 with a standard table visualization? If I can do it only in Time Series maybe you have an example how to declare a formula like this one? doc['clicks'].sum() / doc['pageviews'].sum() * 100
Cheers
Jens
Hi @Bargs
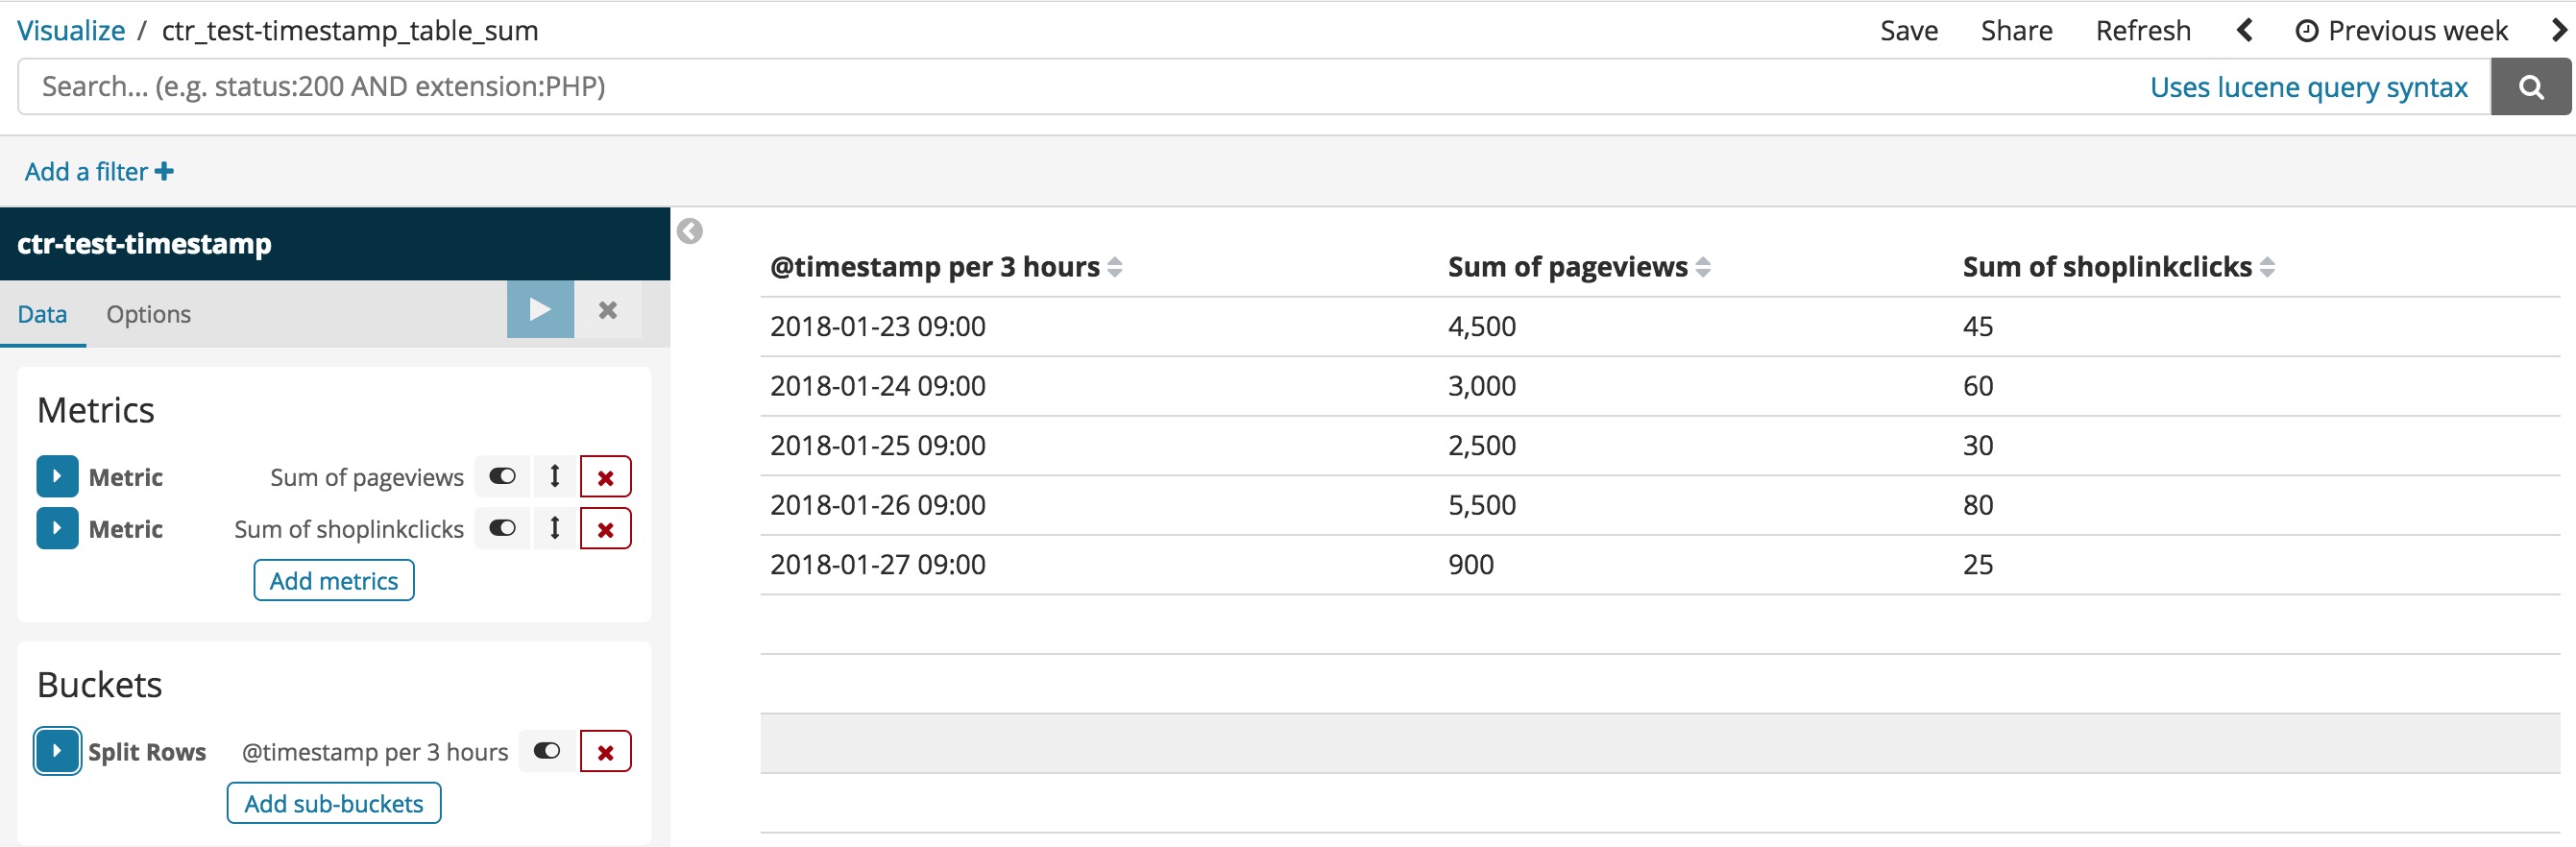
I'm now on 6.1.2 in a local instance of Elasticsearch/Kibana and was able to post some test data via curl into an index. Then I was trying to reproduce your screenshot, but I couldn't find a „Calculation“ Aggregation. Can you tell me where to find it? Is it in Parent Aggregation?
The TSVB table is showing you the "latest value" (the value from the last bucket of the date histogram for your given time range) whereas the core table vis is showing you the totals for the entire time range (in this case, the "Previous week" selected in the timepicker). In TSVB if you want to sum up all the values for the last week, you can go into the Panel Options tab and change the time interval to be one week (you might also have to switch the "Drop Last Bucket" option to "No").
The thing with the time interval is a little bit strange. Why do I have to enter a parameter like 10d in „Interval“ to get the time range I already have defined in the time picker? „auto“ in this field should do the trick.
I agree that TSVB's interaction with the timepicker is a bit confusing, at the very least it should explain what's happening a bit better. There's an open GH ticket for that if you want to give it a or add your own thoughts.
Apache, Apache Lucene, Apache Hadoop, Hadoop, HDFS and the yellow elephant
logo are trademarks of the
Apache Software Foundation
in the United States and/or other countries.


 or add your own thoughts.