Hi All,
I have an index with geo_point data which is mapping flight progress over time using the lat & lon values from a data stream.
For the majority of events they occur over North American so visualizations look ok.
However, when I have events that start in e.g. Japan but at progressing to North America I am looking to determine how these can be visually represented. Currently it will show events split over 1 map set despite repeating. See below
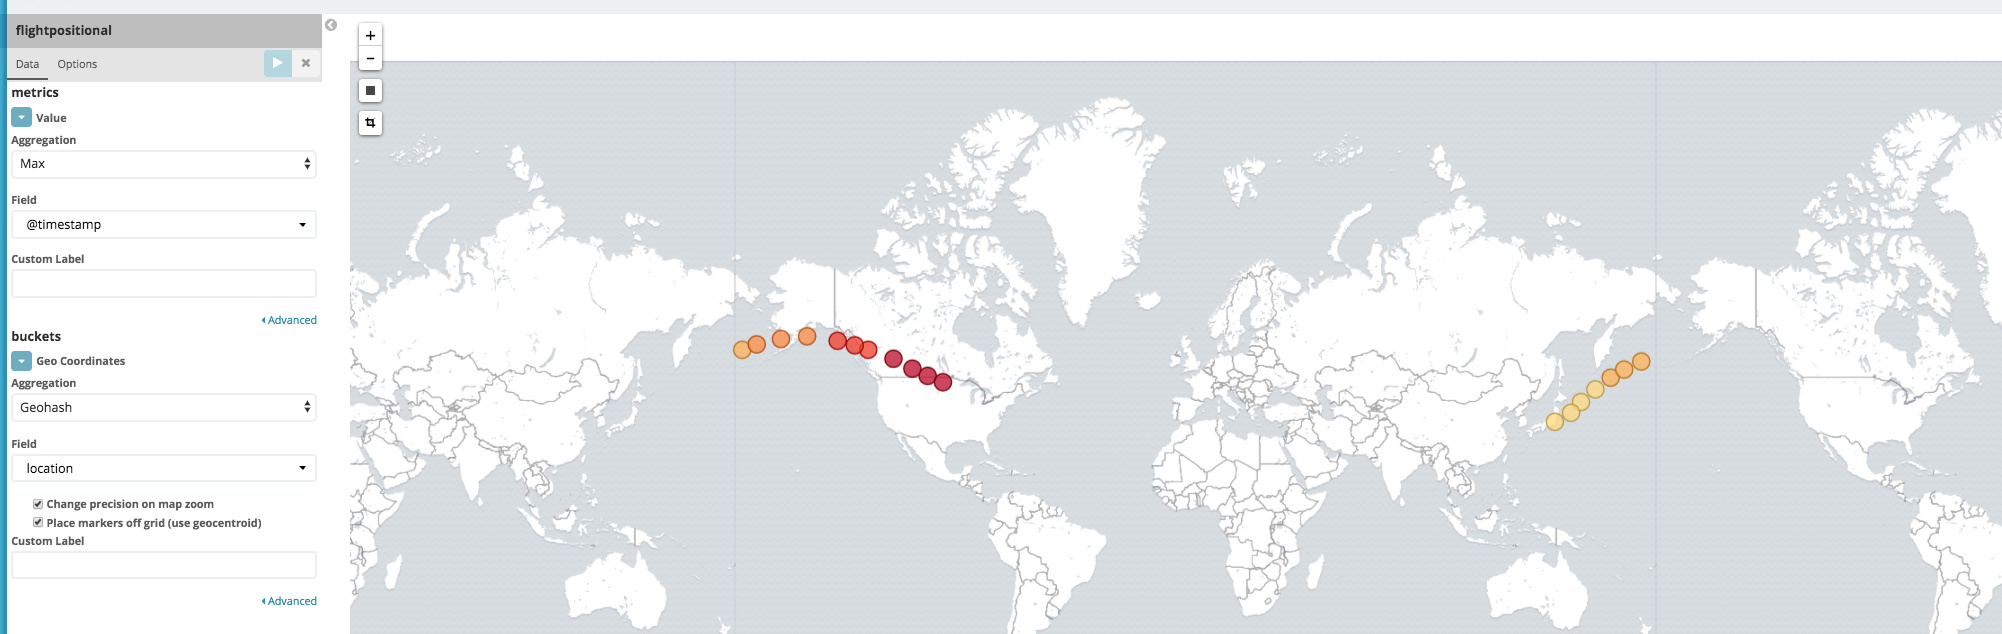
I was hoping that the coordinates would map onto the tiles further to the right and continue on as its repeating the map again - but it doesn't.
Not sure if this is possible.
Thanks
Wayne