Hello,
I am guessing this is not supposed to happen:
Hi @erikg,
That doesn't look right to me either. Is it an intermittent issue or does it persist? Is this on cloud or serverless? If so which ersion?
I would recommend raising a bug issue on elastic/kibana GitHub for this. I'm happy to help with that.
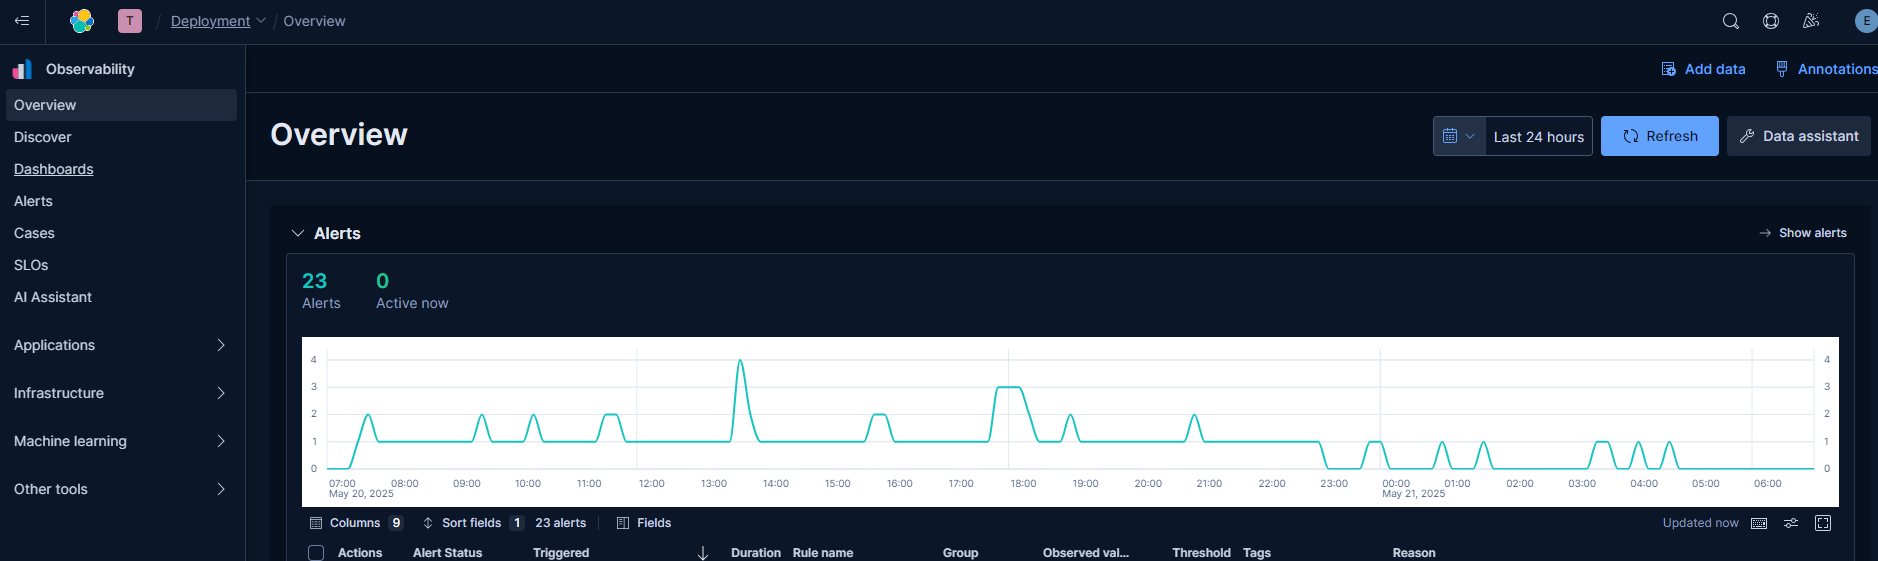
To confirm is this the Observability alerts screen?
Let us know!
Hey @carly.richmond
I am on self managed Kibana/ES version 9.0.1
It happens in the Overview -> Alerts section
© 2020. All Rights Reserved - Elasticsearch
Apache, Apache Lucene, Apache Hadoop, Hadoop, HDFS and the yellow elephant logo are trademarks of the Apache Software Foundation in the United States and/or other countries.