Kibana 5.5:
Elasticsearch 5.5:
CentOS 7:
all browsers:
Hi all, I noticed huge performance issue with Kibana Dashboards. I have Visualization, already tuned to use "match_all": {} for better performance

but when I add this visualization to dashboard, and look into generated request, I have different request, which works slower
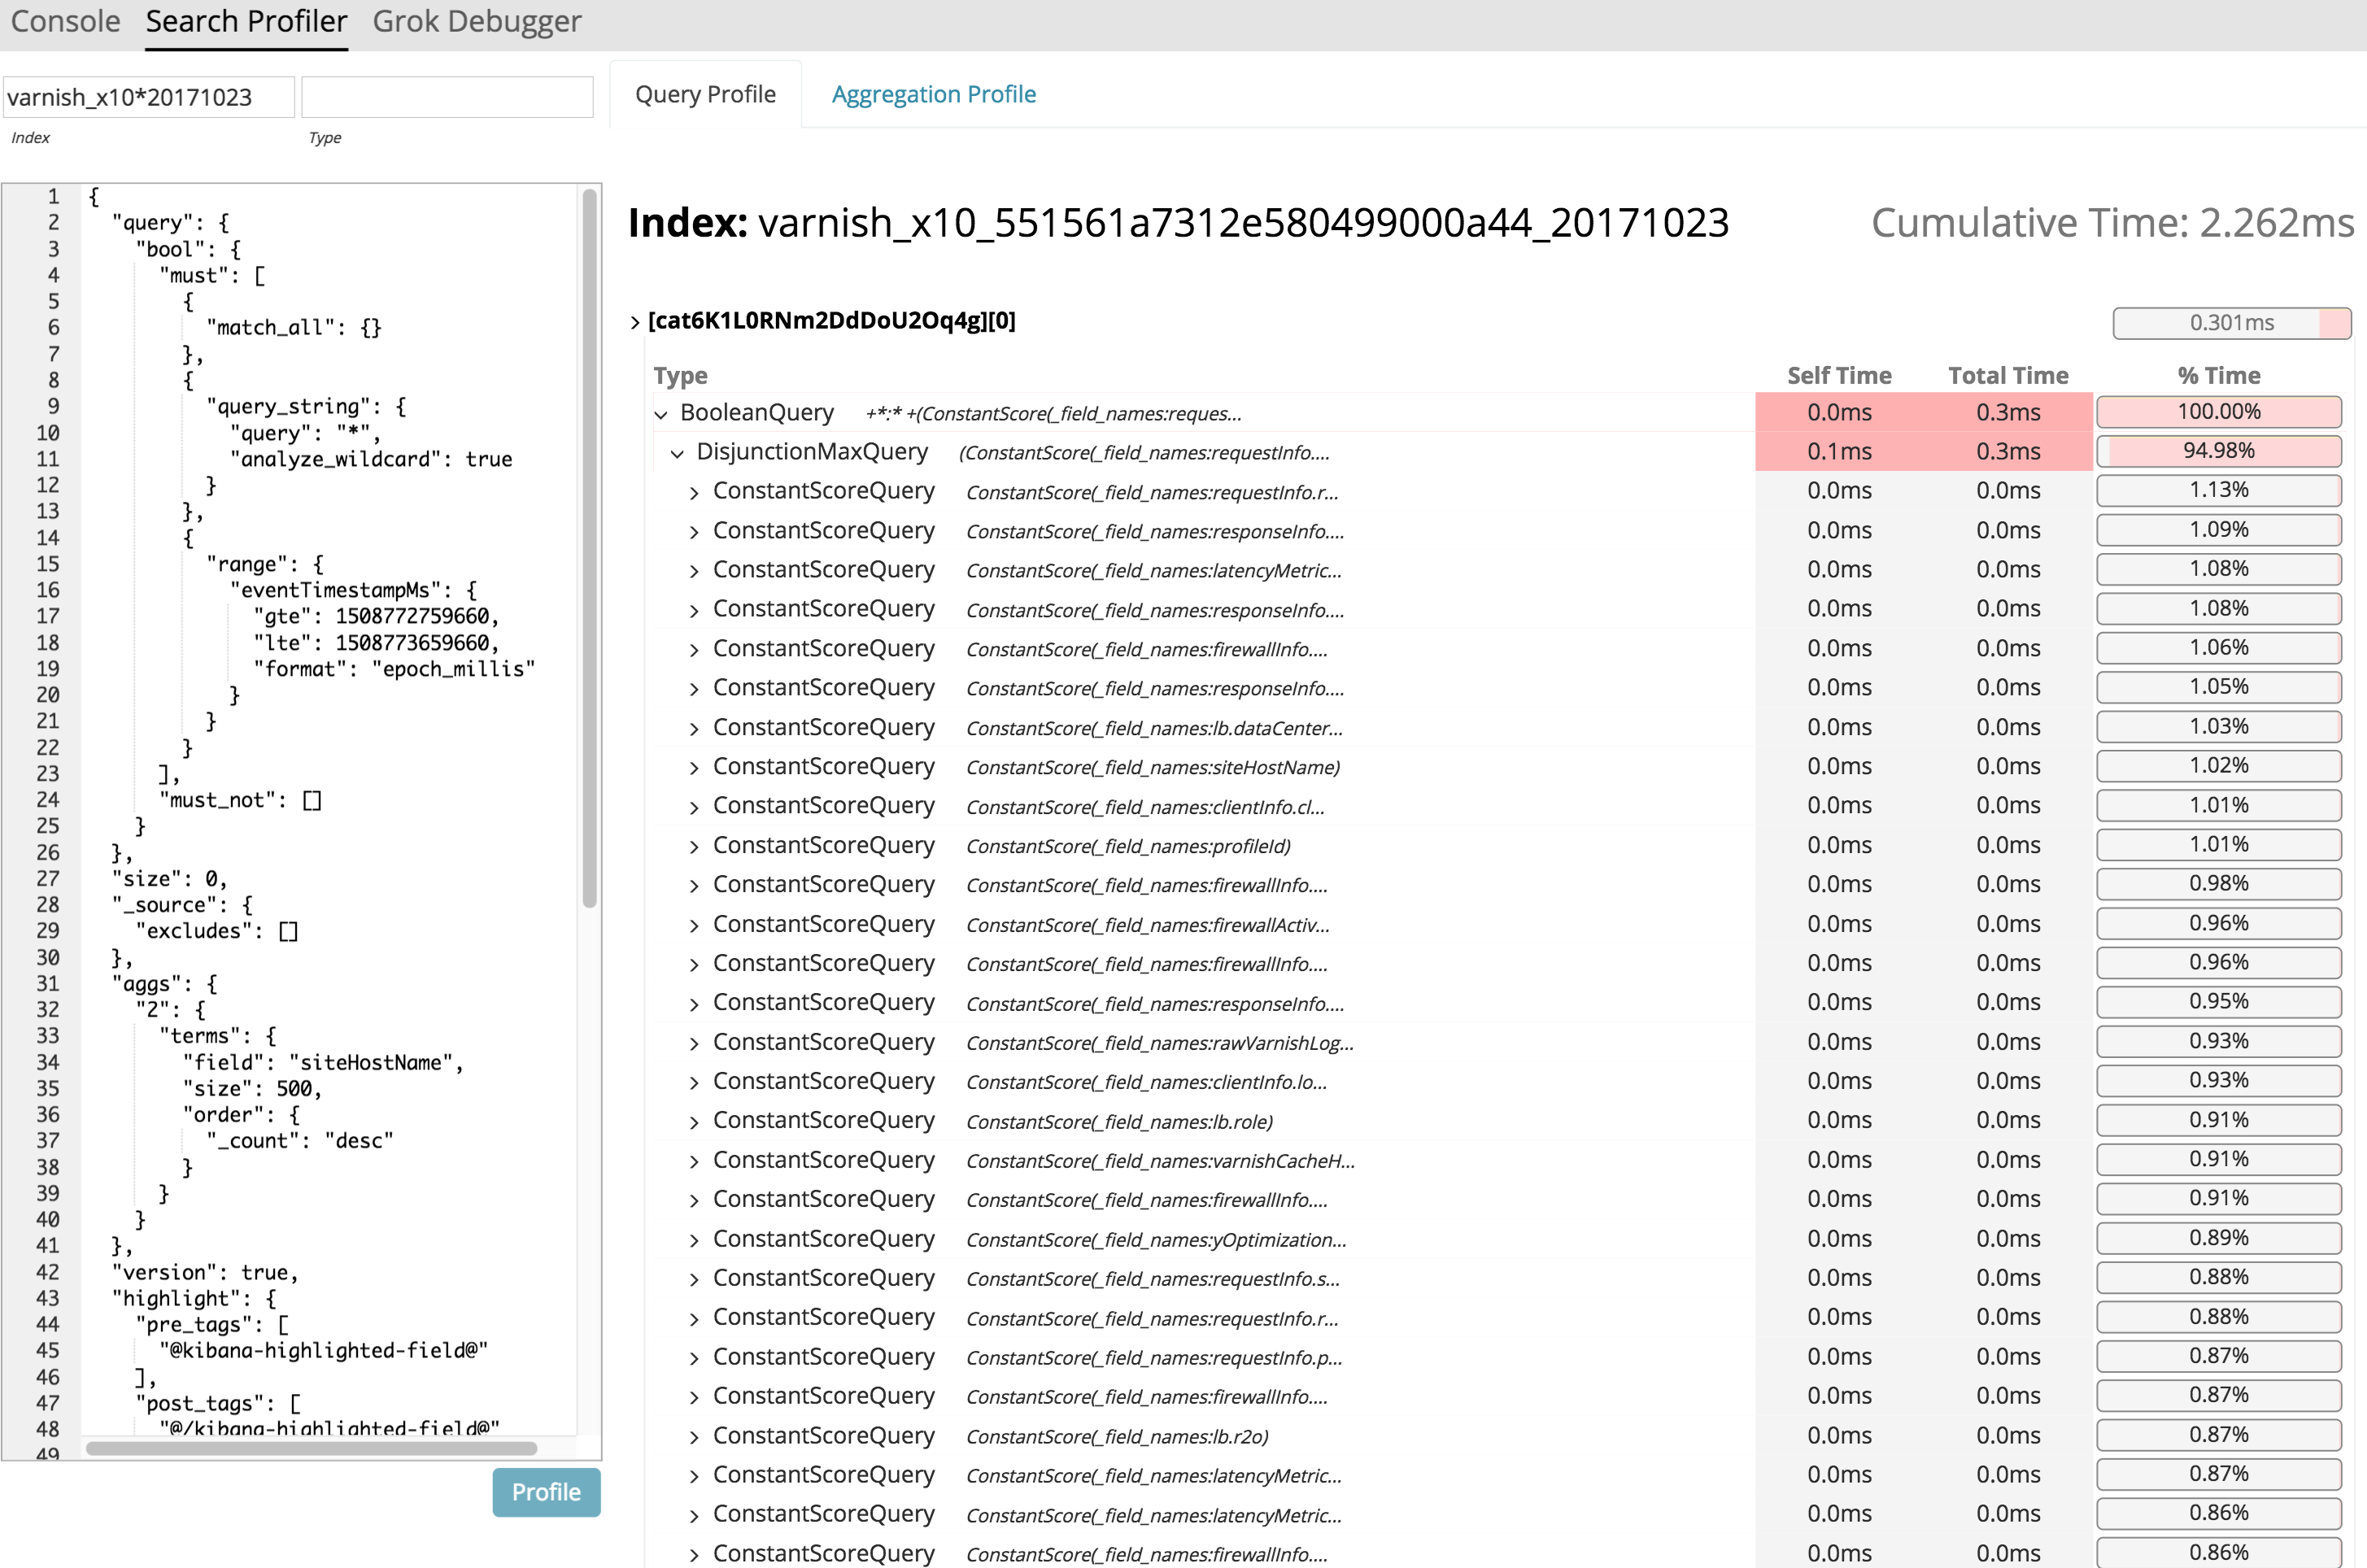
Why Dashboard modified visualization query in such way? How to prevent Dashboard to make such slow request with wildcards when I don't ask for it?
Please help me make kibana dashboard usable again. in ES 2.3.3 didn't have such issue
Opened a defect in github https://github.com/elastic/kibana/issues/14514