I am using Kibana 7 and have a histogram visualization for Core User %. I have confirmed valid data for the cpu's is being sent to Elasticsearch and Kibana can see the data in "Discover". However my visualizations seem to show rows of empty data (see below). I tried aggregating the data via average and max but get similar results. Any idea what is happening?

Hi, could you please share your configuration for that visualization? A screenshot would be helpful. Could you please also share a screenshot of how you've verified the data exists in Discover? And could you please tell me the complete version number you're using, e.g. 7.0.1, 7.1.0? This will help me reproduce what you're seeing.
I am running Kibana 7.0.0
Screenshot of issue on another test:

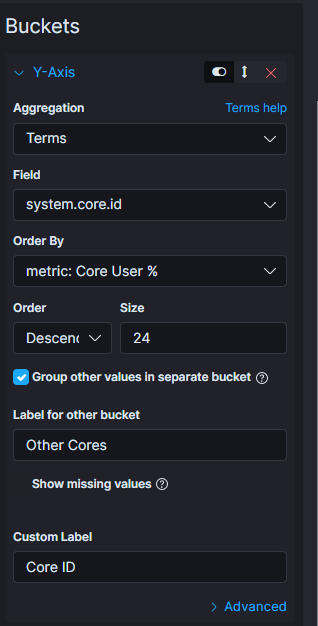
Visualization Configuration:


In the visualization screenshot, there appears to be no data for core 49 between 17:44-17:48. Metricbeat was collecting at 10 second intervals. Below is the Discover screenshot showing data for that time period:


any updates?