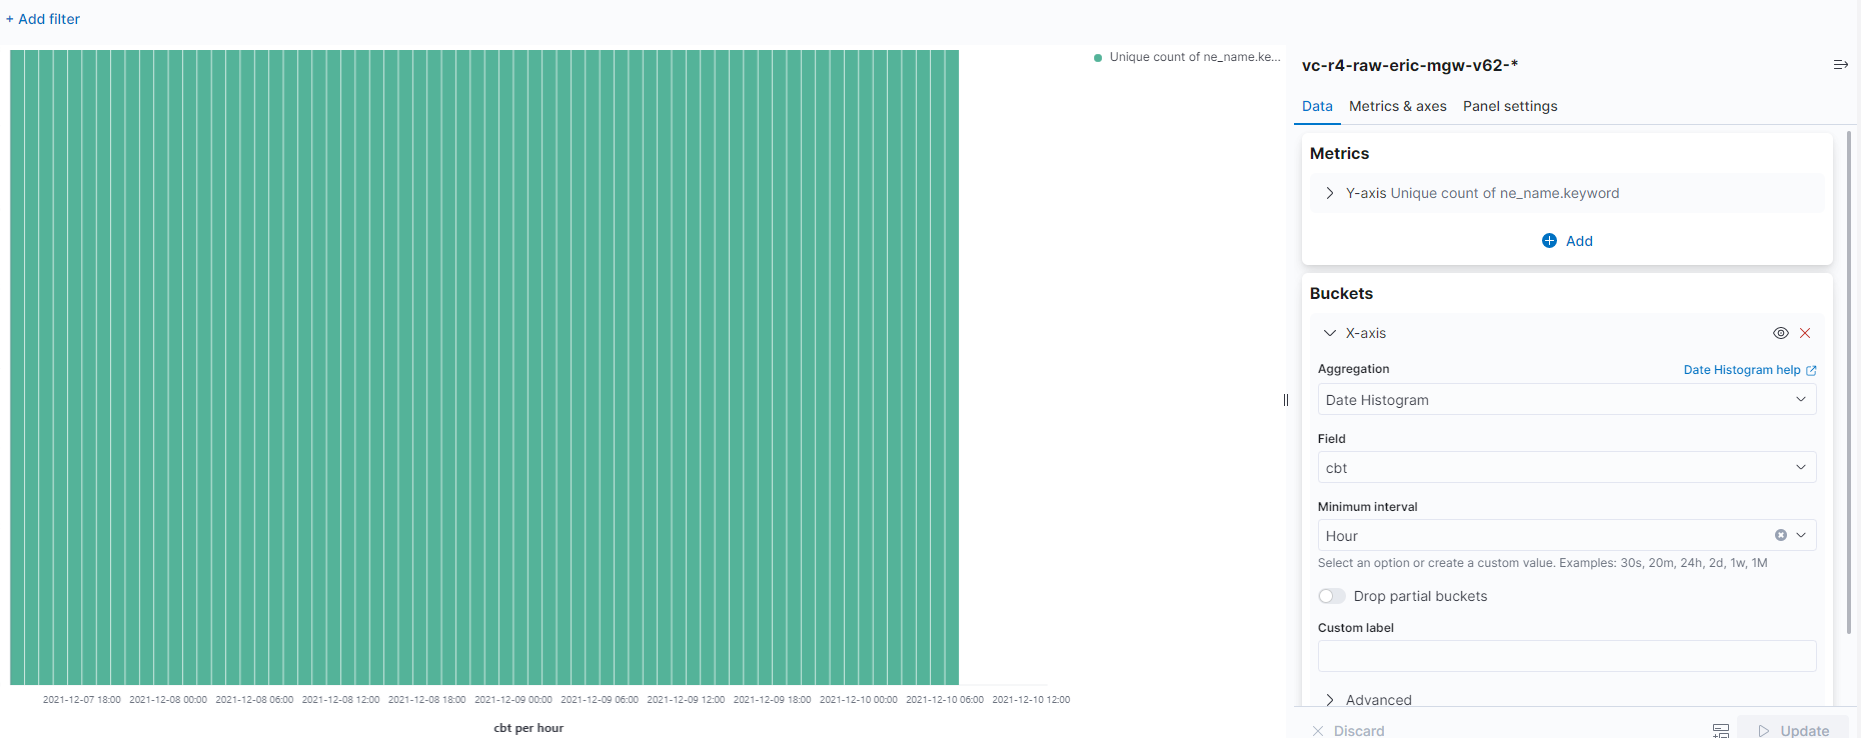
I'm using Kibana 7.15.0 and while using Date Histogram in bucket aggregations, I can't see the date on the bars created when the interval is smaller than 1 hour:
Best available way to control the visualization directly in 7.15 is to consider a custom vega visualization--this gives you precise control of how the axis is formatted. Scroll down to the X-axis on the default sample and try adding a format section like
  x: {
      ...
      axis: {
        title: false,
        format: "%Y-%m-%d %H:%M" // Customize X axis format
        }
    }
As an aside, I wanted to mention we are overhauling the time axis across the variety of visualization editors in Kibana in 8.0 to address this issue (among others). The new time axis @ 8.0 is multi layered and always will show the full date. So you could just wait for an upgrade to solve this hopefully as another option
Thanks for the reply. For our end-users, Lens or Aggregation based visualizations are better suited. We hope to see this facility in those visualizations. Is there any way or work-around for those while we wait for the version upgrade? Specifically for Lens visualizations.
Apache, Apache Lucene, Apache Hadoop, Hadoop, HDFS and the yellow elephant
logo are trademarks of the
Apache Software Foundation
in the United States and/or other countries.