Ever wondered what's really happening in your smart home? When does your heating kick in? How does humidity change throughout the day? What's the temperature pattern in each room?
If you have a Bosch Smart Home Controller II, all this data is flowing through your local network - but it's locked away in an app that only shows you the current state. What if you could capture that stream of events and visualize it over time?
That's exactly what shc2es does: it connects to your Bosch Smart Home Controller, collects real-time device events via long polling, and ingests them into Elasticsearch for time-series visualizations in Kibana.
The Bosch Smart Home Controller II exposes a local API for private, non-commercial use. The controller's API uses long polling to push device state changes in real-time. Temperature readings, humidity levels, door/window states, motion detection - it all comes through as a stream of JSON events.
shc2es taps into this stream using the bosch-smart-home-bridge library, stores everything as NDJSON files, and then ingests it into Elasticsearch with proper field mappings and a ready-to-use dashboard.
Getting Started
Installation
npm install -g shc2es
Configuration
Create a .env file in your working directory:
# Your controller's IP (find it in the Bosch app or your router)
BSH_HOST=192.168.1.100

# System password from Bosch Smart Home app
# (Settings → System → Smart Home Controller)
BSH_PASSWORD=your_password
First Run: Pairing
The first time you connect, you'll need to pair with your controller. This is a one-time security handshake. Before running the script, press the pairing button on your Controller. The script will generate a client certificate that's stored locally for future connections.
shc2es poll
Ingesting into Elasticsearch
The poll script will now perist your smart home data into NDJSON files. Next, we'll set up the Elastic Stack to receive that data. First, set up a local dev environment with start-local:
curl -fsSL https://elastic.co/start-local | sh
Add the Elasticsearch credentials to your .env:
ES_NODE=http://localhost:9200
ES_PASSWORD=your_es_password
KIBANA_NODE=http://localhost:5601
Now run the setup and start ingesting:
# Fetch device/room names for enrichment
shc2es registry

# Create index template + import dashboard
shc2es ingest --setup

# Watch for new events and ingest in real-time
shc2es ingest --watch
Open Kibana → Dashboards → "Smart Home" and you'll see your data come to life. The pre-built dashboard will show room temperature over time as well as the percentage of how far opened the valve's of your radiator thermostats are. Each event is enriched with human-readable device names and room assignments, so you're not staring at cryptic device IDs.
The underlying data structure is clean and query-friendly:
{
  "@timestamp": "2025-12-16T08:30:00.000Z",
  "device.name": "Living Room Thermostat",
  "device.type": "ROOM_CLIMATE_CONTROL",
  "room.name": "Living Room",
  "metric.name": "temperature",
  "metric.value": 21.5
}
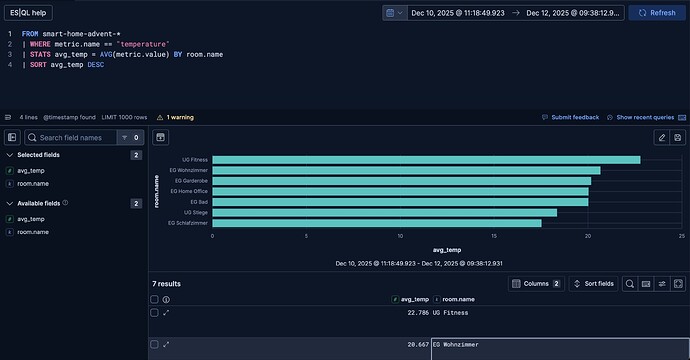
This makes it easy to build your own visualizations or run ES|QL queries:
FROM smart-home-events-*
| WHERE metric.name == "temperature"
| STATS avg_temp = AVG(metric.value) BY room.name
| SORT avg_temp DESC
Bonus: OpenTelemetry Integration
For those running Elastic APM, shc2es includes automatic OpenTelemetry instrumentation via EDOT Node.js. Add your APM endpoint to .env and you get traces and metrics for the polling and ingestion processes themselves.
Try It Out
If you have a Bosch Smart Home Controller II, give it a spin:
- GitHub: github.com/walterra/shc2es
- npm:
npm install -g shc2es
Are you visualizing smart home data in the Elastic Stack? Share your setups in the comments!

