Duplicate Y-Axis value on number

Hi,

I'm trying to create a vertical bar visualizations, but since the Y-axis range isn't big, it creates some weird things.
I want to visualize the max value of invalidBatteryCount over time, this value can be in the range [0;15]
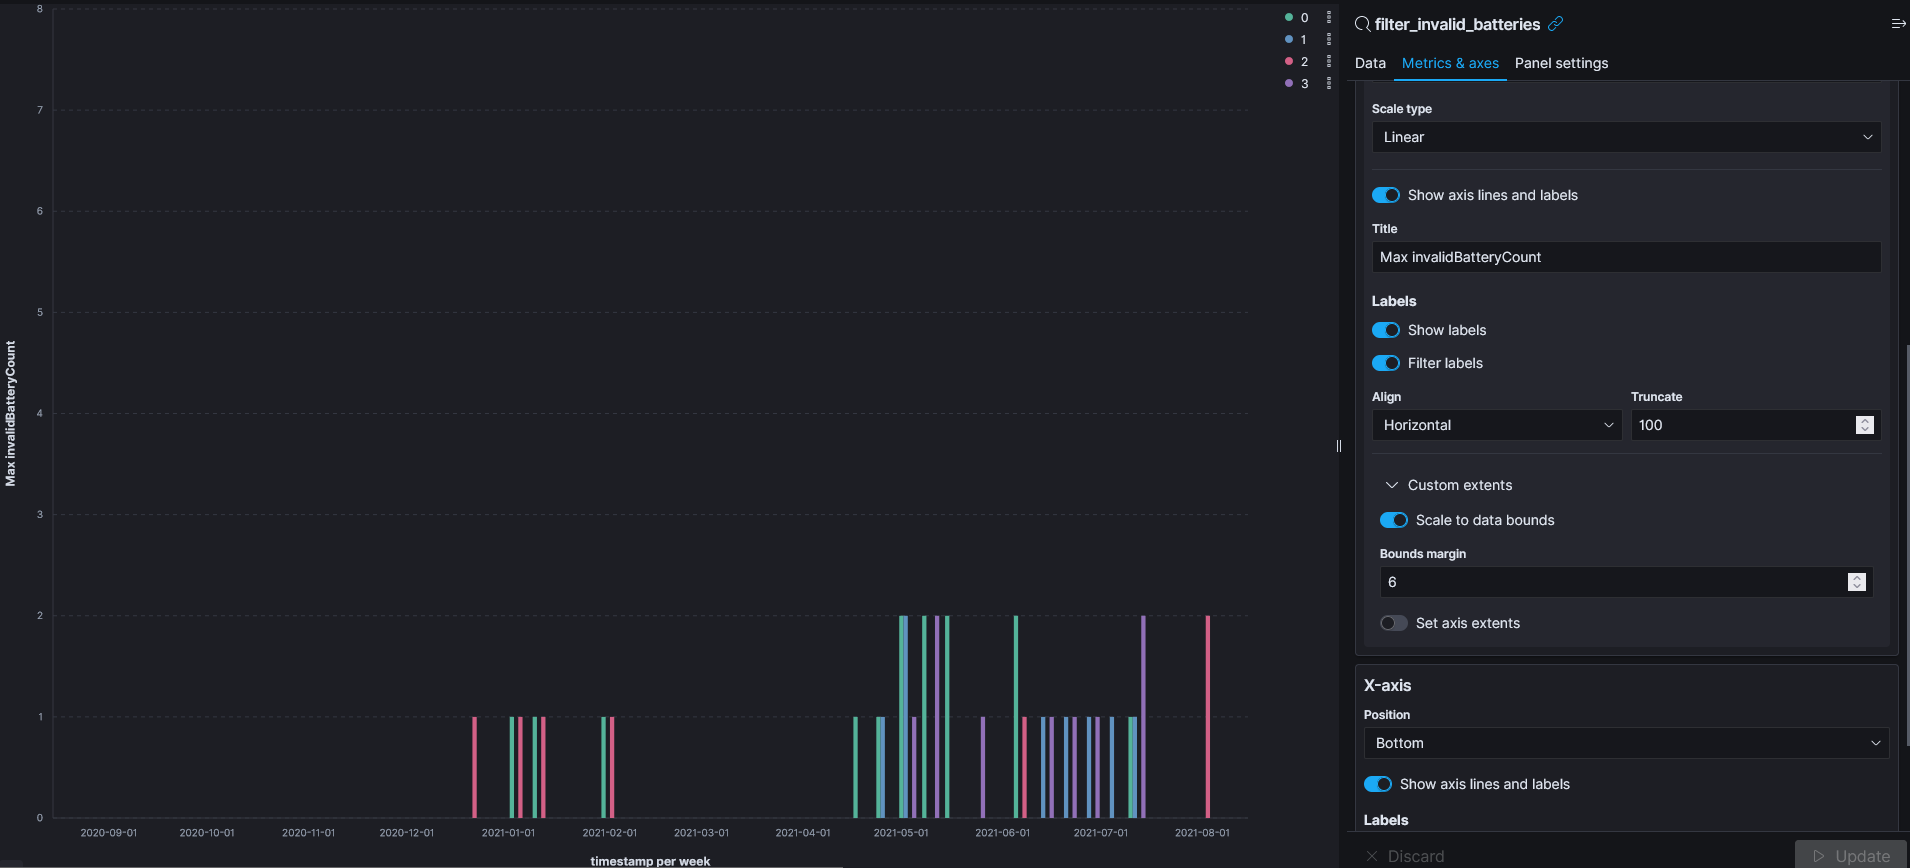
This is what I get by default:


You can see on the Y-axis, I have duplicate for each value.

I manage to remove duplicate by activating the "filter labels" options, but then the labels/grid is not aligned with the vertical bar:

By playing with the custom extents, I saw that starting at a range of [0;8], the Y-axis stop having weird behaviour:


Is there a way to have that same behaviour, without having to change the data bounds manually? And so having it automatically change to the max value in the period selected?

Thanks :slight_smile:

Hey! Which kibana version do you use? I want to try replicating it. Also can you also share with me the configuration of your data tab?

Hello,

We're currently on the v7.13.4

For the data, it's just a really basic vertical bar:
Y-Axis: "Max" Aggregation on any field (with value low enough to reproduce)
X-Axis: Date Histogram
I also have a split series on X in "normal" mode (no stack), but the problem is present without this split too.


This will reproduce the first version of visualization I linked (without the filter label option).
From there you can reproduce the 3 other by doing the same thing I described in the original post.

Hmmm interesting I can't reproduce it. Why type is the invalidBatterycount. Moreover if you go to advanced settings and switch on this setting

is it still happening?

I tried enabling the options but the problems remains.
However I saw the invalidBatteryCount has been set to a long, actually like every other numbers value, when they all should be integer, this is probably what's creating this behaviour. Is there a way to change the mapping of an index to update the type of fields?

I just tried importing some data in our test server, and changing the mapping from long to integer, but the problem persist.

Can you create a sample dataset and send it to me ?
Have you tried the above setting that I sent you? Moreover, do you also replicate it with Lens?

You can try with this sample:

timestamp;playerID;invalidBatteryCount
2021-05-18T17:16:32+02:00;0;2
2021-05-18T16:09:47+02:00;0;2
2021-05-15T19:06:34+02:00;3;2
2021-05-15T16:40:08+02:00;0;2
2021-05-14T22:04:07+02:00;3;2
2021-05-14T16:50:49+02:00;0;2
2021-05-13T21:10:27+02:00;2;0
2021-05-13T18:59:29+02:00;0;2
2021-05-13T17:32:21+02:00;0;2
2021-05-13T13:50:24+02:00;0;2
2021-05-12T19:06:55+02:00;0;2
2021-05-12T15:30:55+02:00;3;1
2021-05-08T21:44:29+02:00;0;2
2021-05-08T19:06:03+02:00;1;2
2021-05-08T16:34:11+02:00;1;2
2021-05-07T21:38:45+02:00;2;0
2021-05-07T21:11:15+02:00;3;1

That sample give me a result that looks like this

The legacy chart options did not fixed it, but it does change something, since the filter labels
options doesn't remove duplicate anymore.

Creating the visualization from the Lens doesn't create duplicate but fail to align of grid/value:

Ok I am on a 7.13.4 instance. I ingested your sample data that they were mapped as:


Here id --> playerId
and to_max --> invalidBatterCount

I create a new vertical bar with your settings (or at least this is what I think)
and the result is correct

So my question is. Have you changed this advanced setting?

Ah... I indeed changed that format to 0,0.
That fix it the y-axis, however... is it a normal behaviour to have labels/grid for these decimal values when the field you're counting is an integer? :thinking:

It has to do with how ES returns the max aggregation. If you run

POST /my_index/_search?size=0
{
  "aggs": {
    "max_price": { "max": { "field": "to_max" } }
  }
}

the response is:

Indeed, seems like min and max force it to double...

This topic was automatically closed 28 days after the last reply. New replies are no longer allowed.