Elastic agent Does not receive traffic, but it reaches the Linux server

Elasticsearch is configured with a Palo Alto Integration a corresponding Agent Policy and Agent.
The Agent itself is installed on an Ubuntu Linux machine:

The Ubuntu machine itself receives the traffic:

But the Agent Logs on Kibana gui shows the following:

And yeah the Agent is "listening" for UDP traffic on that particular configured port.

What am I missing? Why doesnt it work?

Thanks!

I have installed the Agent on another Linux VM and the result is the same.
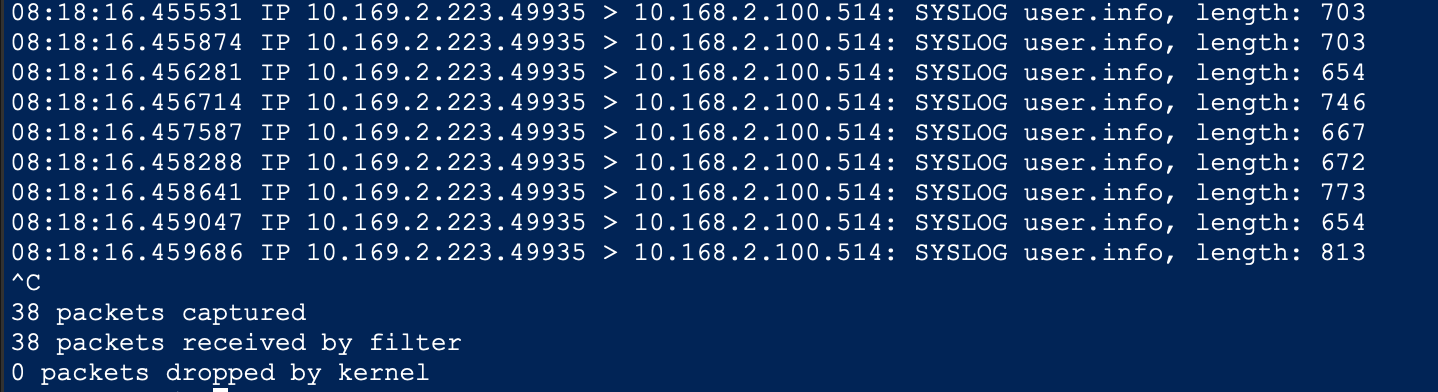
TCPdump shows the incoming traffic, 0 kernel or firewall drops but the Agent does not reveive it, logs that no Monitoritong data in last X sec.

Any Suggestions?

Thanks.

Hello!

Did someone meet with this problem?

What log file should I examine which may lead me to the root cause?

Thanks.

Hello,

You need to share the configuration you made in the agent, please share some screenshots of the integration configuration you have in fleet.

You need to provide evidence of that, please share the result of a netstat command for the port you are using.

Also, do you have anything else in the Elastic Agent logs?

Integration config:

Corresponding Policy:

Netstat result shows the same port config:

Syslog still coming as tcpdump shows:

Agent ofc running and enabled:

Thanks in Advance

Agent logs:

There are a couple of errors in the log, it seems that the udp input is restarting constantly.

See, the second line has an information about the status changing from HEALTHY to STOPPED.

Then later on it changes from STARTING to HEALTHY and then again to HEALTHY to STOPPED, and the process pid also changed.

Something is not working right.

Can you check the system logs for any hint? I think that in Ubuntu it would be in /var/log/syslog.

Only Elastic related logs:

This topic was automatically closed 28 days after the last reply. New replies are no longer allowed.