I'm having some problems with the Visual Builder Gauge visualization.
I have all the data on some given indices (say test_1, test_2, test_3, test_4) between the 2019/07/10 and 2019/07/20.
I wanted to make a percentage of the error events over the total (log_level: ERROR / log_level: *) and I'm using the filter ratio agg of the VB Gauge, as I successfully did in the past.
Now, couple of problems:
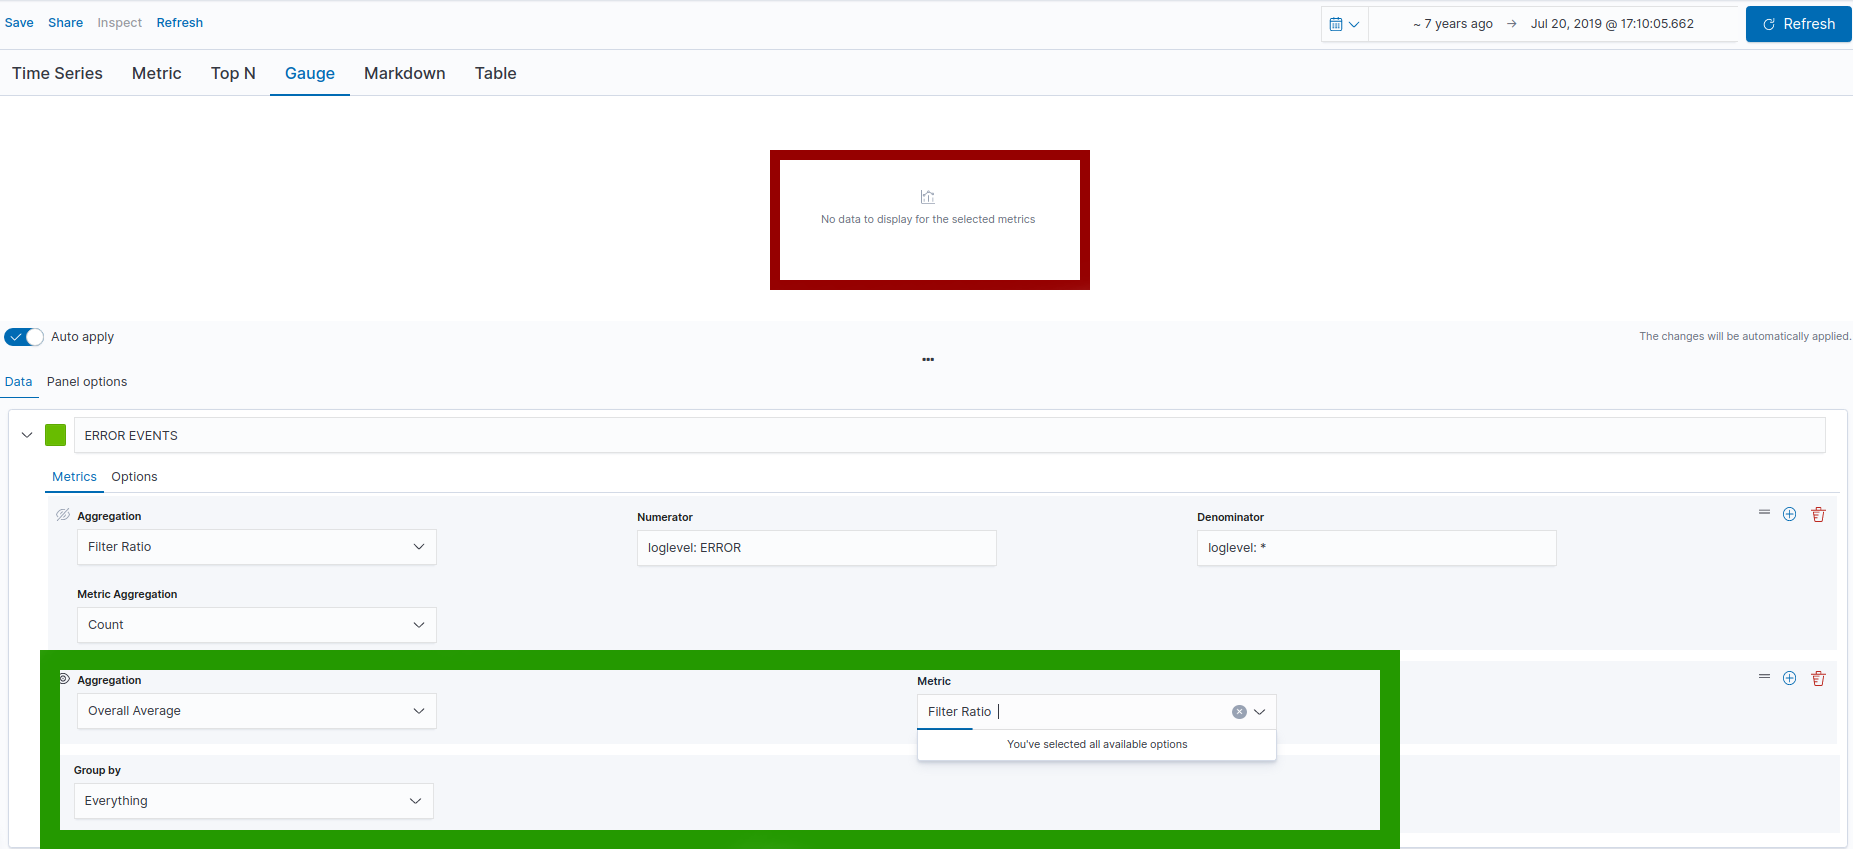
Differently from the past, if I use a parent/sibling aggregation after the Filter Ratio (like the Overall Average, which was necessary to get the right estimate in past releases), it shows me "No data to visualize".
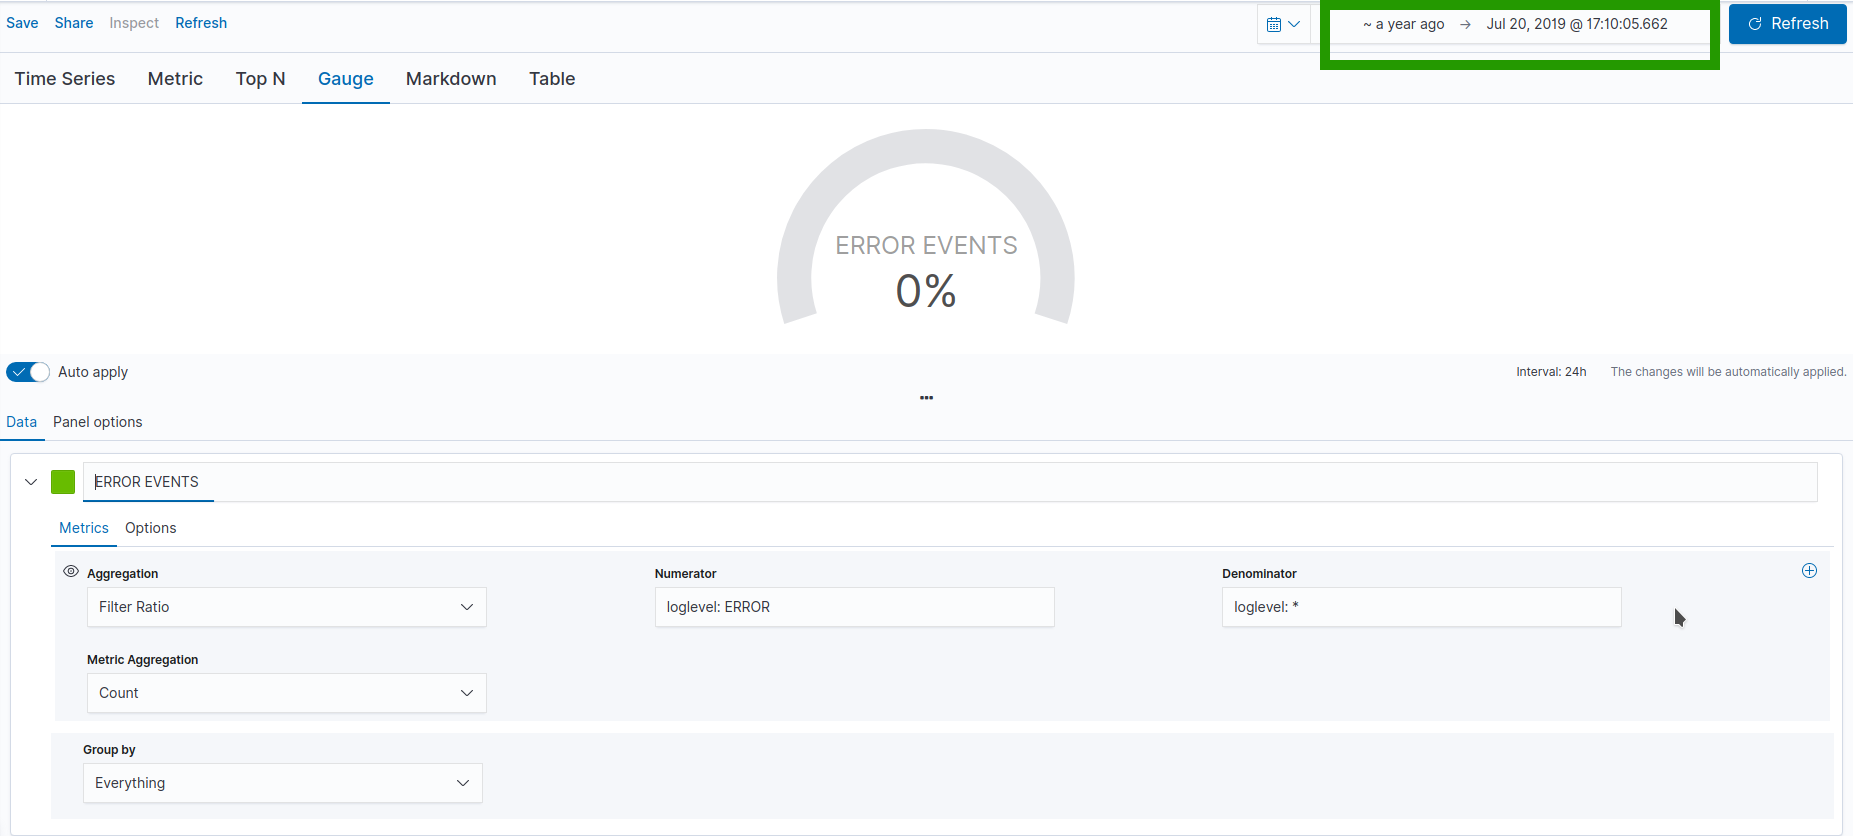
If I only keep the Filter Ratio agg with the Count metric, it returns the right estimate only if I set a very large timespan, like 6 years ago-now, even if the data are only present withn the above-mentioned timerange.
Before you ask, I only have one temporal field (@timestamp edited in Logstash and recognized as correct time field by the index pattern).
Is it a bug of the 7.3 release? Otherwise, what can cause this strange behavior?
In case they might help, I'll post some screenshots.
As you can see from these first two screens, I only have data (for that specific index pattern) between 2019-07-10 and 2019-07-20. In fact, setting the from parameter equal to ~7 years ago didn't change the number of docs.
Now, moving to the Visual Builder Gauge visualization, I set these preferences in the Panel Options (index pattern is obviously the same of the one used in the Discovery section):
In the Data section, as you can see from the following pics, first, I do not need any sibling or parent aggregation to get some results. On the contrary, if I try and put one (as I used to do in 6.6.1 for example) it even tells me No data to display for the selected metrics.
Though, if I remove the sibling aggregation, I can only see the right percentage setting an incredibly wide timespan (~7 years, not even ~1 year), which doesn't make sense since I only have data within a very restricted timerange.
Yes, Overall Overage is broken in 7.3.0- not sure what version you upgraded from, but the bug was only caught recently and is backported for the 7.3.1 release: https://github.com/elastic/kibana/pull/42074
Last time I used the Overall Average was in 6.6.1 and it kinda worked.
Now the overall average doesn't work, but it looks like a problem of the Visual Builder in general to me. Since it's not normal I can see the right value by increasing the timerange where there are no data, regardless of the Overall Average.
Apache, Apache Lucene, Apache Hadoop, Hadoop, HDFS and the yellow elephant
logo are trademarks of the
Apache Software Foundation
in the United States and/or other countries.