Fleet server, policy, and integrations for Linux terminal

Hello everyone. I want to watch my Linux terminal with simple integrations and custom-defined rules. Right now, I’ve tried system, auditd, or both at the same time. But there is always something wrong with the fleet server and policy. If you follow the Kibana UI, you first need to create a fleet server. It gets created easily, no problem. But then it leads you to something like ‘create your first agent’ or something. I can’t recall right now.

In this auto generated commands, it gives you the same two commands that you already run when creating the policy. I’ve tried running them again, but it said “Error: already installed at: /opt/Elastic/Agent”. I’ve tried only running the last piece of command, which is something with a token, it also gave the same error. Even after I discard this process, there is a fleet server, policy, and integrations. I continued anyways. But when I defined some simple rules like “Catch ‘ls’ command”, it doesn’t even working. I am sure KQL is correct though.

When I check the status, elastic agent seams healthy. I can give you any information you need about the whole problem. Please let me know and help me solve this, its been 2 days. Thanks.

Hello @Eren_Cil

Welcome to the Community.

#As per your requirement, you have a Linux host 'abc' where you want to monitor terminal activity.
Fleet Server is installed on host 'xyz' and enrolled with the default Fleet Server policy.
#We create a Linux Policy
In Kibana → Fleet → Agent Policies :
#Create a new policy, e.g. Linux.
Add integrations:
System (for basic host metrics, syslog, and auth logs)
Auditd Logs
#Enroll the Linux Agent
In Fleet → Agents → Add Agent , select your new 'Linux' policy.
Run the generated command on your Linux host 'abc'
Once enrolled we will see 'abc' listed as Healthy in Kibana under Fleet → Agents.

For detailed steps, please check:

I see below details :

Could you please share what is the issue you are facing?

Thanks!!

Where you installed the Fleet Server?

You can have only one Elastic Agent running on each host, normally you would have a dedicated host to run your Fleet Server, and then you would create different policies to install in your other hosts.

If you installed the Fleet Server on the same host you want to monitor, you need to add the integrations to the fleet server policies.

Can you share exactly what you have configured in Fleet?

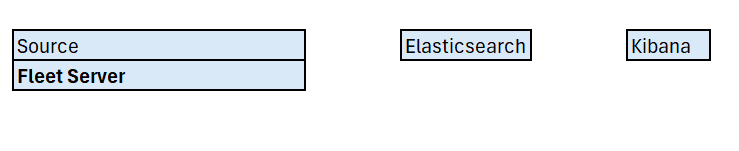
Basically what I want to do is, observe my Linux terminal with custom-defined rules. I think I need some integrations/agents to do that. This why I am trying to create a Fleet server and an agent policy. Everything is running on the same machine. I think this might be the issue, I was not aware of that.

I have static IP in my both machines (Linux and a Mac). Mac machine plays the role of attacker, and Linux machine plays the role of victim. I safely simulate attack scenarios from my Mac (while having access to Linux C2) with different techniques. And the rules which are specifically designed to catch my step by step attack, will catch them and save logs.

My fleet server’s host URL is https://192.168.0.200:8220, which is the static IP that I have on my Linux, and default port that Elastic suggests. After that, I use this commands to install Fleet server to my Linux machine:

curl -L -O ``https://artifacts.elastic.co/downloads/beats/elastic-agent/elastic-agent-9.2.0-linux-x86_64.tar.gz
tar xzvf elastic-agent-9.2.0-linux-x86_64.tar.gz
cd elastic-agent-9.2.0-linux-x86_64
sudo ./elastic-agent install \
--fleet-server-es=http://localhost:9200 \
--fleet-server-service-token=”can’t_publish_that” \
--fleet-server-policy=fleet-server-policy \
--fleet-server-port=8220 \
--install-servers

An experienced friend of mine also suggested using ‘insecure’ flag here to prevent possible further complications with integrations. After that fleet connection is confirmed in Kibana UI, it automatically leads me to:

Continue enrolling elastic agent

And from there, there is the ‘Enroll in Fleet’ option. It says:

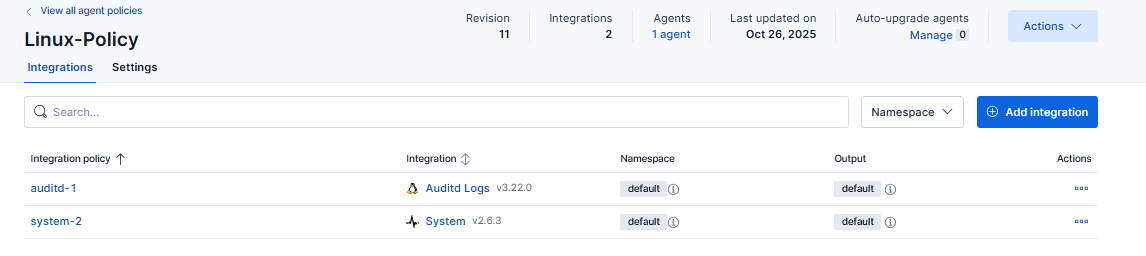
The selected agent policy will collect data for 1 integration: system

Here it says ‘Install Elastic Agent on your host’. Under that, there is a warning:

Root priviliges required. This agent policy contains the following integrations that require Elastic Agents to have root priviliges. blablabla: system

I know that if you don’t add –unpriviliged flag, there is no problem. I also can use priviliged afterwards. I don’t know it makes a difference though. And here is the commands for installing elastic agent on my host:

curl -L -O ``https://artifacts.elastic.co/downloads/beats/elastic-agent/elastic-agent-9.2.0-linux-x86_64.tar.gz
tar xzvf elastic-agent-9.2.0-linux-x86_64.tar.gz
cd elastic-agent-9.2.0-linux-x86_64
sudo ./elastic-agent install --url=https://192.168.0.200:8220 --enrollment-token=blablalba

It is the same thing! This why it gives an error. Do I have to use two separate machines? And even if I use that, how the other will be able to communicate with the other? Now it waits for agent enrollment. I also can close this window, but I don’t know what happens then.

I am really a beginner for Elastic Stack as you can see. So, any help is appreciated. Thanks for your time and patience.

Hey, thanks for the welcome!

I replied with a very detailed response below. Can you please check that out too?

Main issue is I can’t even see my console logs in the Discover section. I think it is also an indicator that shows my terminal is being watched by some integrations, right?

The other issue is after creating the fleet server, Kibana UI leads me to add Elastic Agent, which is what we also did in the previous step and it gives an error. And since it gives an error (Agent already exists and I can’t confirm incoming data), I don’t know how to proceed.

If I’ll be able to do that, then I’ll proceed to create custom rules that’ll get triggered and save logs. As you mentioned, do I have to use two separate machines to do what I want?

Maybe I need to add another extra URL for my Fleet server? And if I do that, in what shape it needs to be?

Thanks for your time!

Hello @Eren_Cil

Actually as you have installed the Fleet Server on the Source (Linux Host) , so now no need to install the Elastic Agent again on this host & hence the error as Elastic Agent is already installed as part of the Fleet Server.

Since you only have 1 host for now you can use the same Fleet Server Policy to send data from Source to Elastic.

In this case to the existing Policy you can add integration to collect the data from Source Linux machine & send to ELK.

if Fleet server is installed on a dedicated host then it will look like below :

In your case it is below scenario :

Thanks!!

1 Like

Thank you so much! I didn’t know that.

1 Like