If I generate a pdf report from Kibana web UI, using Share > PDF Reports > Generate PDF.
Then I got to : Stack Management > Reporting > Download report
The resulting report just has:

ELK Stack version 7.11.2
The same happens if I try and generate a png report.
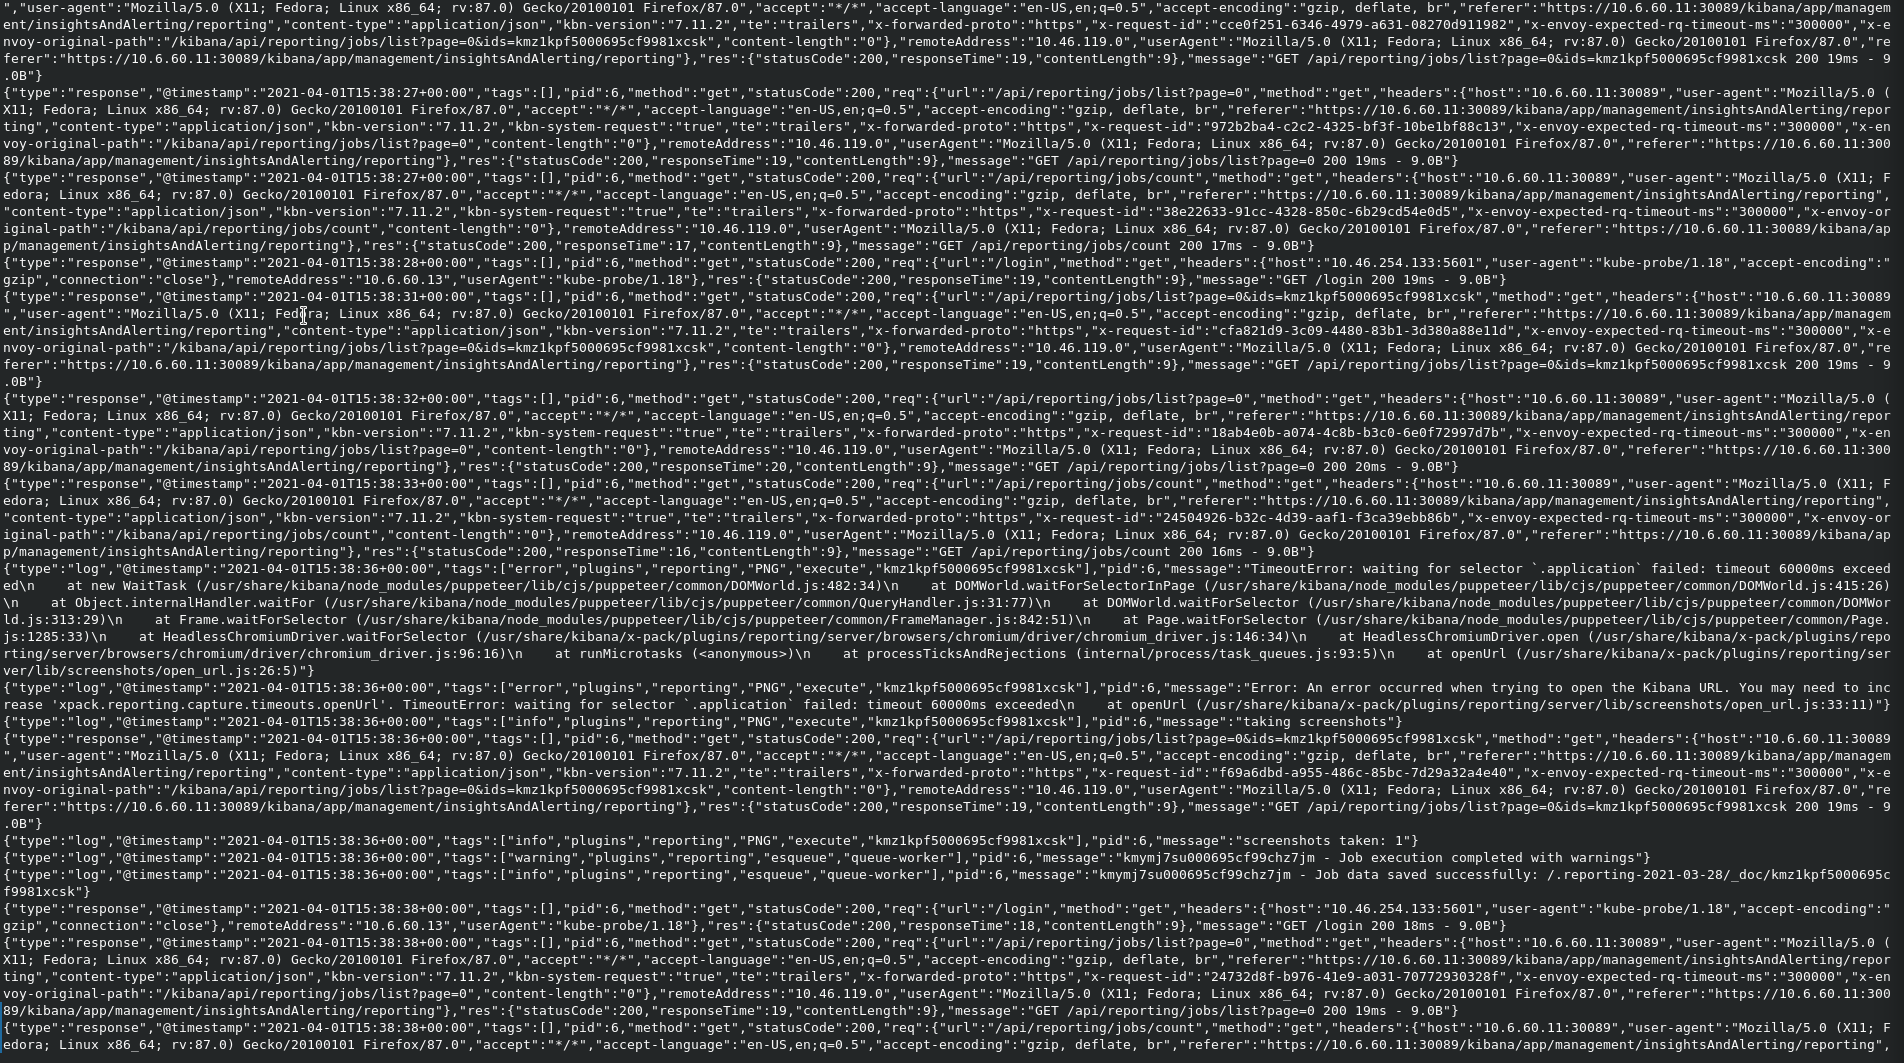
Extract from kibana logs:
Hi @eeiijlar
from the log screenshot it seems that the server goes in timeout when generating the report.
You may either increase the xpack.reporting.queue.timeout.
At this page you can find all the specific parameters with timeout defaults for reporting: Add Kibana user settings | Elasticsearch Service Documentation | Elastic
Another option would be to increase the amount of RAM dedicated to the Kibana server. This also has worked for other users who are dealing with big PDF reports.
Hi @Marco_Liberati
I doubled the resources availabe to kibana in kubernetes:
    containers:
    - name: kibana
      resources:
        requests:
          cpu: "2"
          memory: 4G
        limits:
          cpu: "2"
          memory: 8G
It didn't make any difference. I also tried a png, which has 120 second timeout as opposed to 60 second for pdf. It produced the same error. Now though I see the following in the logs:
That SSL error seems to be relative to the certificate not being liked by the engine used to create the report PDF/PNG (same as a browser). You can find more about it in this issue.
May I ask some information about your kubernetes configuration?
For example do you have a SERVER_BASEPATH value? How is set?
That may help to debug a configuration issue.
Hi @Marco_Liberati
Where can I get the value of SERVER_BASEPATH? I have checked the environment on the kibana pod, but I don't see it set there. I am assuming it is an environment variable.
John
Yes, that is an environment variable.
Is it possible to see some kubernetes config? That may help.
Which config specifically?
This is what our pods look like:
NAMESPACE           NAME                                                       READY   STATUS      RESTARTS   AGE
cert-manager        cert-manager-545b78f84-27fl9                               1/1     Running     1          12d
cert-manager        cert-manager-cainjector-cfc495bc5-h8x4k                    1/1     Running     18         12d
cert-manager        cert-manager-webhook-56fb559c6b-zcczm                      1/1     Running     0          12d
consul              consul-consul-cwzxf                                        1/1     Running     1          13d
consul              consul-consul-p4qn2                                        1/1     Running     1          13d
consul              consul-consul-server-0                                     1/1     Running     39         13d
consul              consul-consul-server-1                                     1/1     Running     42         13d
consul              consul-consul-server-2                                     1/1     Running     2          25h
consul              consul-consul-tq5lp                                        1/1     Running     1          13d
fleet-system        fleet-agent-86bd4555b5-p4gx7                               1/1     Running     2          13d
monitoring          elastic-operator-0                                         1/1     Running     1          11m
monitoring          gateway-6596c5fbfd-jlqzd                                   1/1     Running     2          11m
monitoring          gateway-proxy-79554b4856-x8k78                             1/1     Running     0          11m
monitoring          gloo-7775df6cc9-d5gkf                                      1/1     Running     2          11m
monitoring          monitoring-elasticsearch-es-default-0                      1/1     Running     0          10m
monitoring          monitoring-fb-beat-filebeat-6jh42                          1/1     Running     0          10m
monitoring          monitoring-fb-beat-filebeat-dngk7                          1/1     Running     0          10m
monitoring          monitoring-fb-beat-filebeat-zsqrs                          1/1     Running     0          10m
monitoring          monitoring-kibana-kb-6b47cffc8f-b492b                      1/1     Running     0          10m
monitoring          monitoring-kube-state-metrics-6748dc48f6-r86xr             1/1     Running     0          11m
monitoring          monitoring-logstash-0                                      1/1     Running     0          11m
monitoring          monitoring-mb-beat-metricbeat-2f6v4                        1/1     Running     1          9m43s
monitoring          monitoring-mb-beat-metricbeat-fjcr4                        1/1     Running     1          9m43s
monitoring          monitoring-mb-beat-metricbeat-p2p69                        1/1     Running     1          9m43s
monitoring          monitoring-metrics-beat-metricbeat-5d695d78b5-6lqqv        1/1     Running     1          9m43s
One thing which may be non standard is that each of our services have the name of the service appended onto the url, so the Kibana url will be: https://<k8s ip>:<k8s port>/kibana, elastic will be: https://<k8s ip>:<k8s port>/elasticsearch etc
Any ideas @Marco_Liberati ? I will have to open a support ticket if not.
We also see this error:
"type":"log","@timestamp":"2021-04-13T12:50:48+00:00","tags":["error","plugins","reporting","printable_pdf","execute-job","kng0v4hw00060534945dwt94","kng0v4hw00060534945dwt94"],"pid":6,"message":"TimeoutError: waiting for selector `.application` failed: timeout 60000ms exceeded\n    at new WaitTask (/usr/share/kibana/node_modules/puppeteer/lib/cjs/puppeteer/common/DOMWorld.js:482:34)\n    at DOMWorld.waitForSelectorInPage (/usr/share/kibana/node_modules/puppeteer/lib/cjs/puppeteer/common/DOMWorld.js:415:26)\n    at Object.internalHandler.waitFor (/usr/share/kibana/node_modules/puppeteer/lib/cjs/puppeteer/common/QueryHandler.js:31:77)\n    at DOMWorld.waitForSelector (/usr/share/kibana/node_modules/puppeteer/lib/cjs/puppeteer/common/DOMWorld.js:313:29)\n    at Frame.waitForSelector (/usr/share/kibana/node_modules/puppeteer/lib/cjs/puppeteer/common/FrameManager.js:842:51)\n    at Page.waitForSelector (/usr/share/kibana/node_modules/puppeteer/lib/cjs/puppeteer/common/Page.js:1285:33)\n    at HeadlessChromiumDriver.waitForSelector (/usr/share/kibana/x-pack/plugins/reporting/server/browsers/chromium/driver/chromium_driver.js:146:34)\n    at HeadlessChromiumDriver.open (/usr/share/kibana/x-pack/plugins/reporting/server/browsers/chromium/driver/chromium_driver.js:96:16)\n    at processTicksAndRejections (internal/process/task_queues.js:93:5)\n    at openUrl (/usr/share/kibana/x-pack/plugins/reporting/server/lib/screenshots/open_url.js:26:5)"}
{"type":"log","@timestamp":"2021-04-13T12:50:48+00:00","tags":["error","plugins","reporting","printable_pdf","execute-job","kng0v4hw00060534945dwt94","kng0v4hw00060534945dwt94"],"pid":6,"message":"Error: An error occurred when trying to open the Kibana URL. You may need to increase 'xpack.reporting.capture.timeouts.openUrl'. TimeoutError: waiting for selector `.application` failed: timeout 60000ms exceeded\n    at openUrl (/usr/share/kibana/x-pack/plugins/reporting/server/lib/screenshots/open_url.js:33:11)"}
Hi @eeijlar ,
I tried to look into the issue more, but I think opening a support ticket would provide better help on this topic.