I have this data:

I use this filter:
{
"query": {
"bool": {
"filter": [
{
"script": {
"script": "doc['endTime'].date.isAfter(doc['due'].date)"
}
}
]
}
}
}
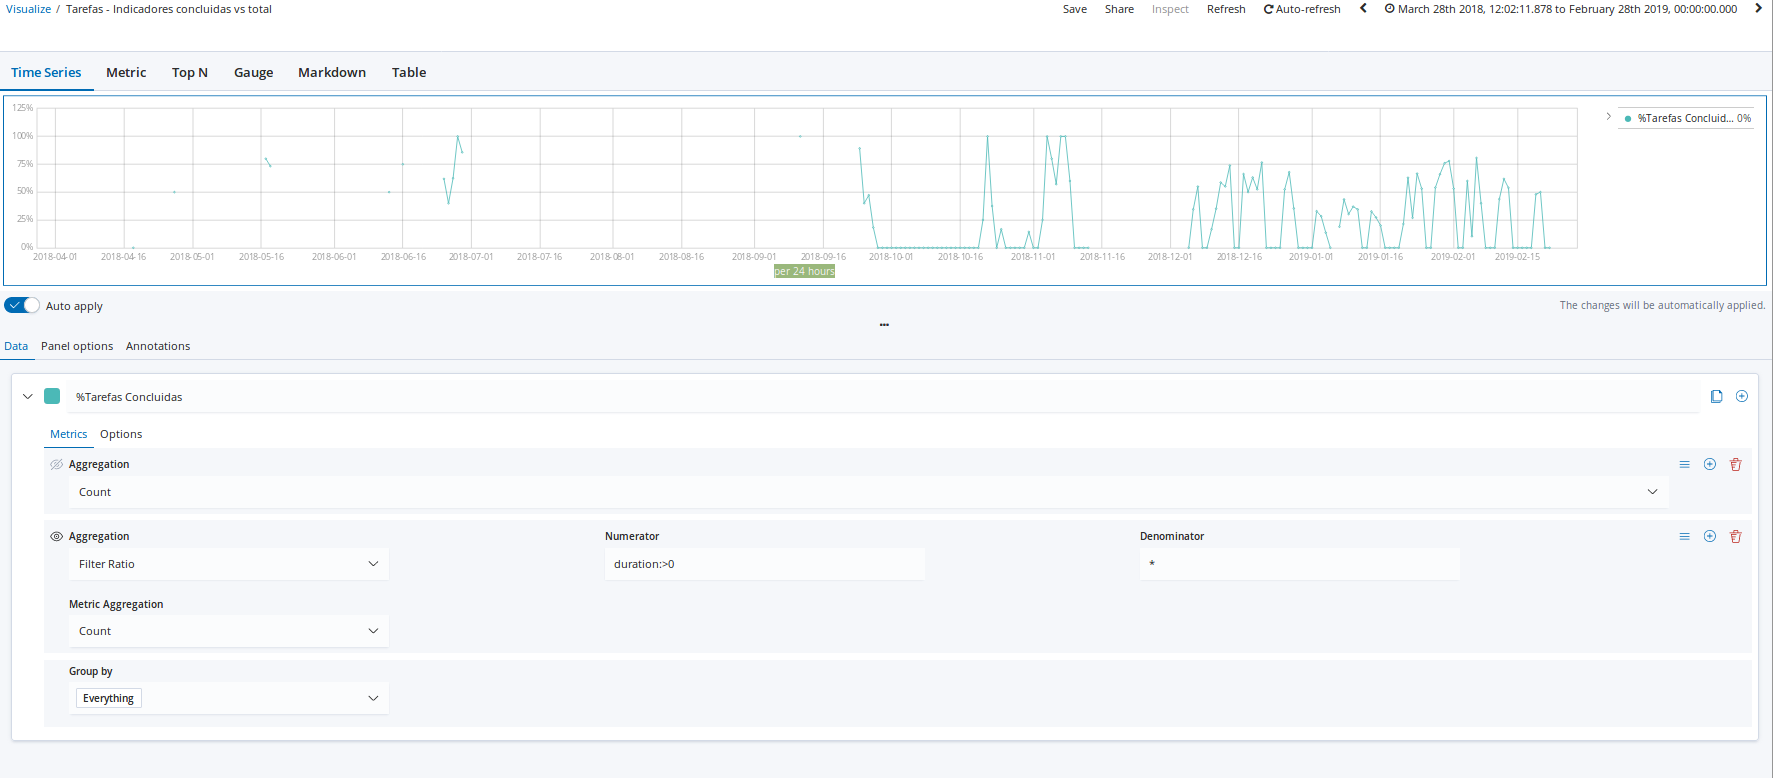
i would like build a visualization where i count how many tasks endTime is after dueDate (due).
I use visualbuilder where i have two aggregation (one count and other is filter radio). But if i define numerator endTime:>due the result is 0. Is not correct.

what i do wrong?
if i use other numerator work well. Example duration:>0