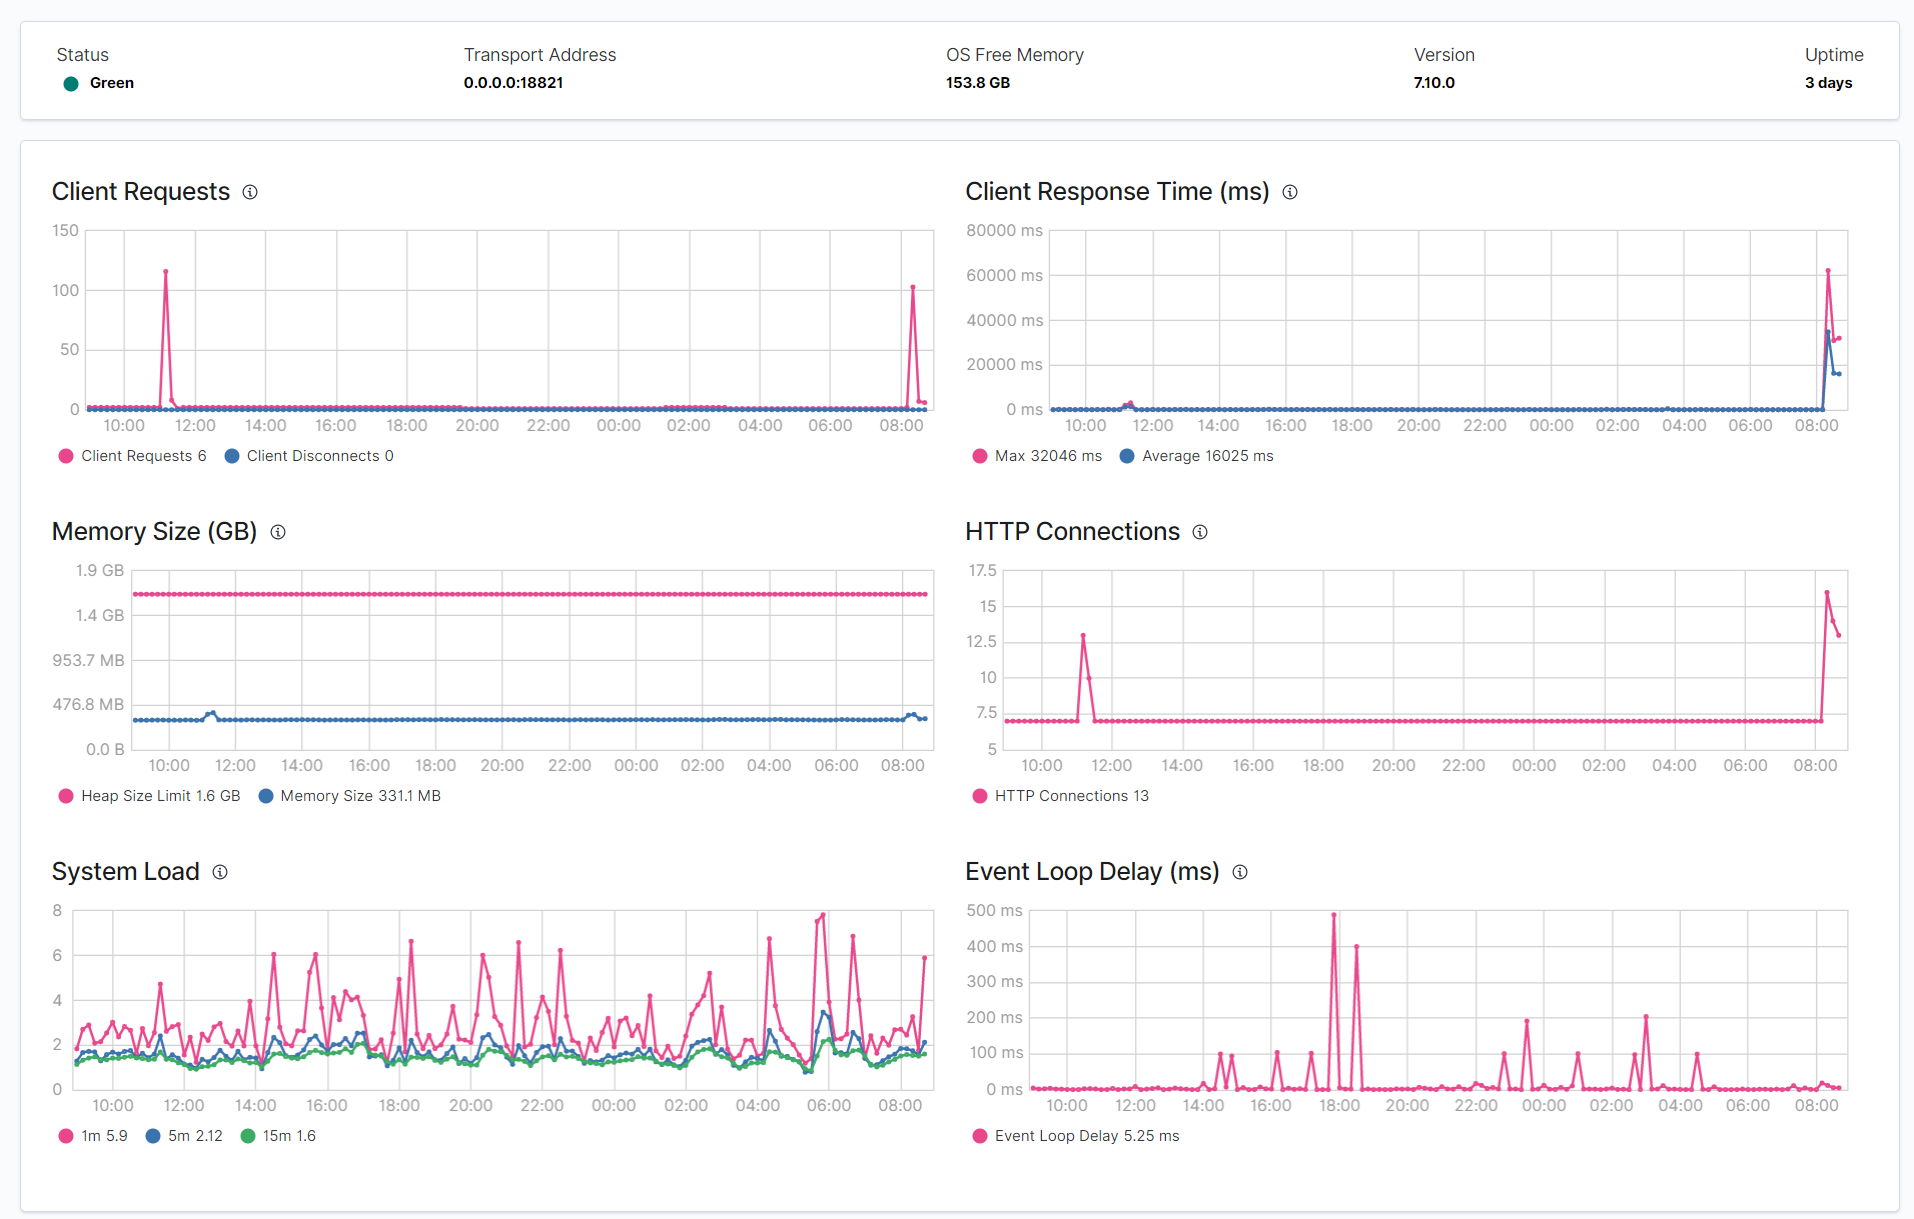
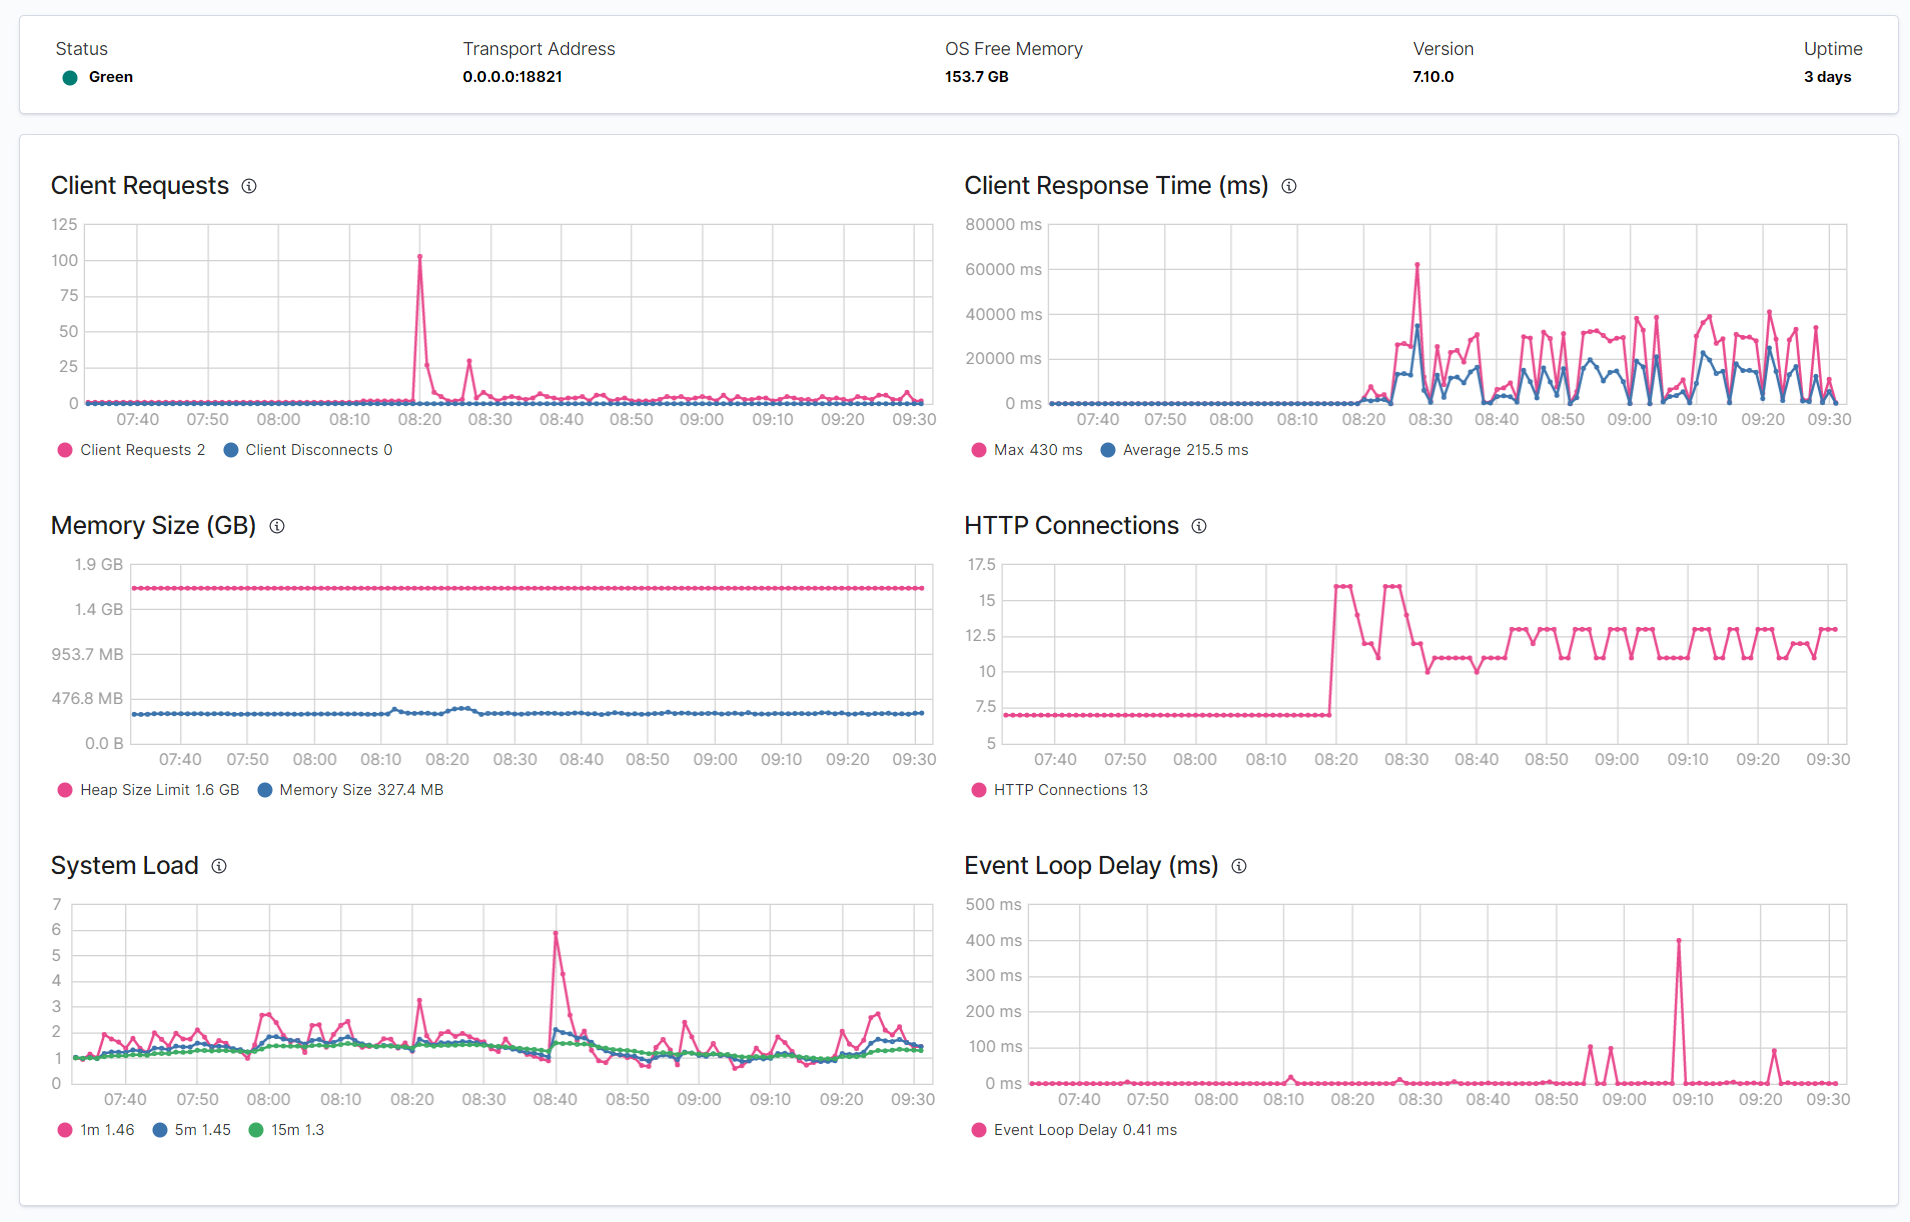
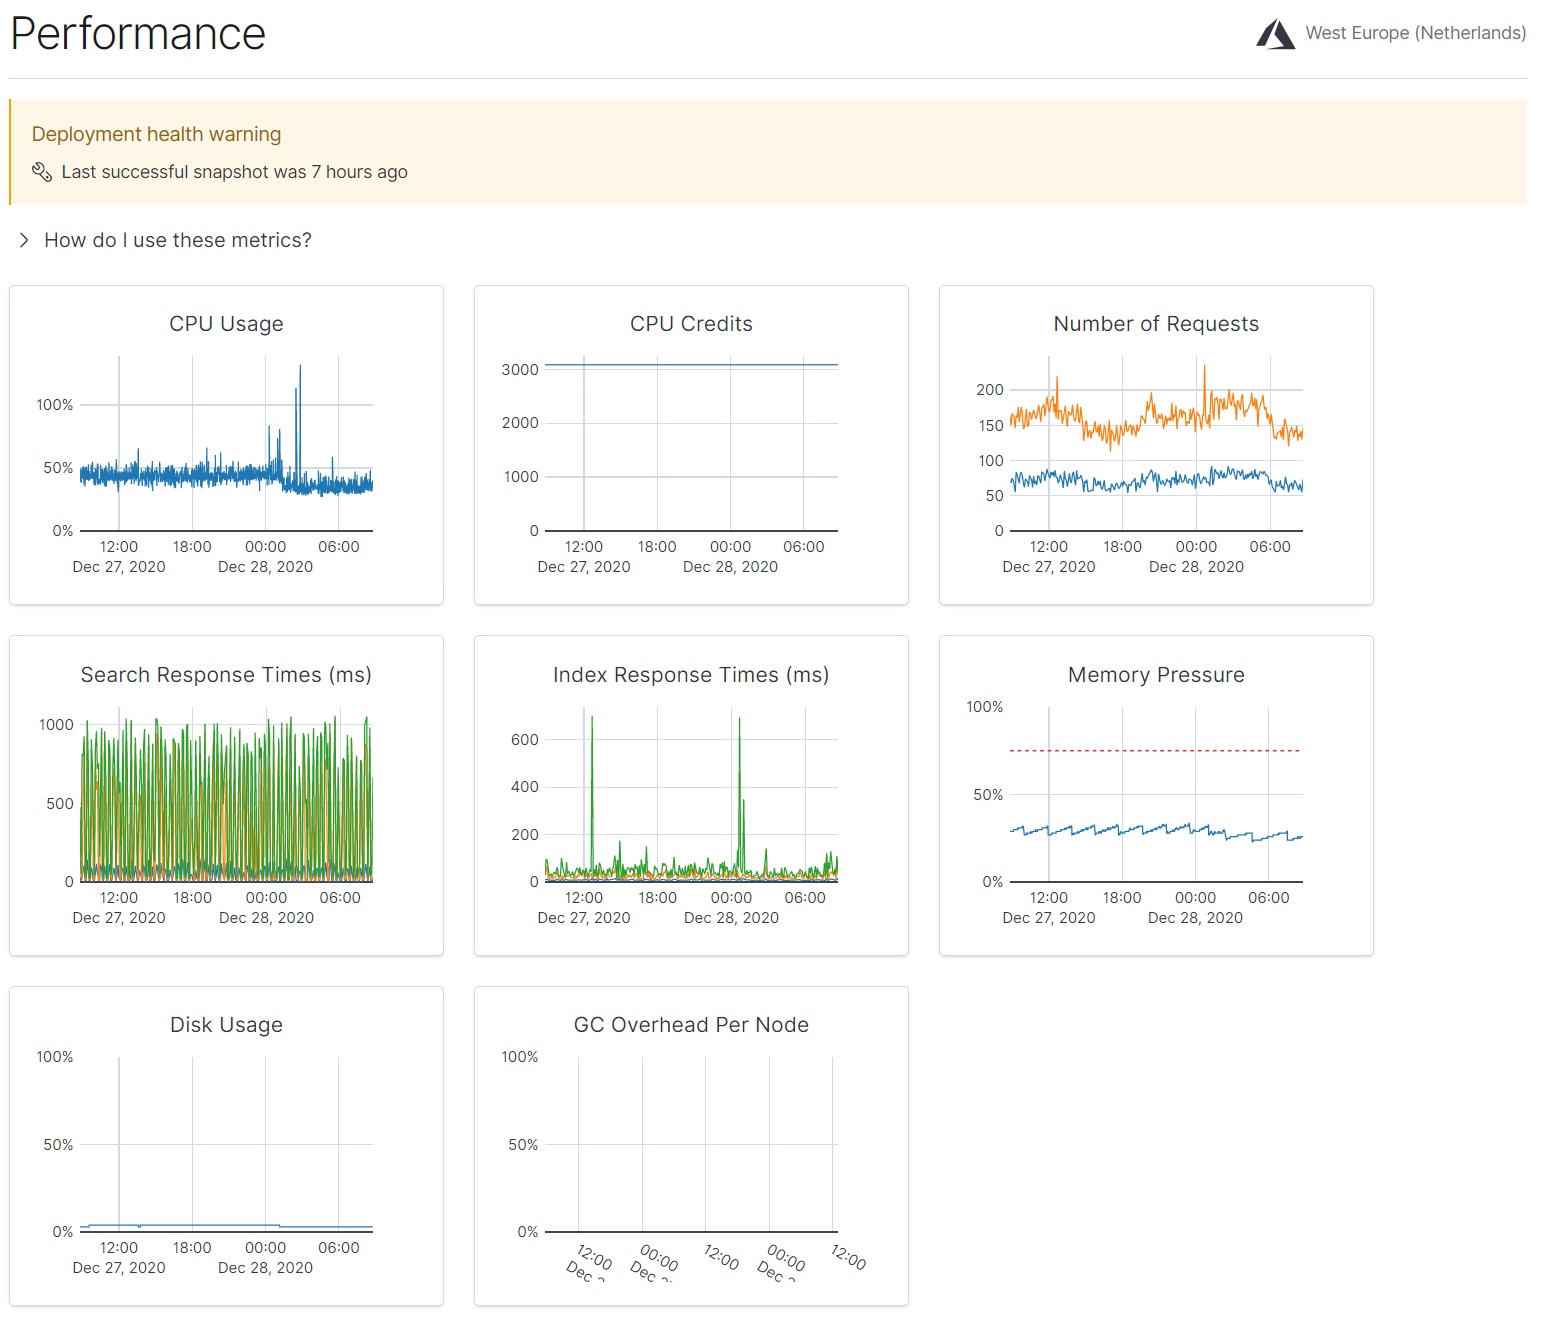
This doesn't make sense to me, how can Stack Monitoring take up so much CPU? These are the new performance graphs after I've turned Stack Monitoring back on. Can you spot the moment that happened?
Before enabling monitoring, CPU usage was around 30%, after enabling monitoring it jumped to around 150% 
This is the GET /_tasks?human output:
{
  "nodes" : {
    "xOYwLFnDQvOre0gOnWQNPg" : {
      "name" : "instance-0000000005",
      "transport_address" : "10.46.24.70:19941",
      "host" : "10.46.24.70",
      "ip" : "10.46.24.70:19941",
      "roles" : [
        "data",
        "data_cold",
        "data_content",
        "data_hot",
        "data_warm",
        "ingest",
        "master",
        "remote_cluster_client",
        "transform"
      ],
      "attributes" : {
        "logical_availability_zone" : "zone-0",
        "server_name" : "instance-0000000005.6a43cf2206664fce853a683f47dfb878",
        "availability_zone" : "westeurope-3",
        "xpack.installed" : "true",
        "instance_configuration" : "azure.data.highio.l32sv2",
        "transform.node" : "true",
        "region" : "unknown-region"
      },
      "tasks" : {
        "xOYwLFnDQvOre0gOnWQNPg:122977" : {
          "node" : "xOYwLFnDQvOre0gOnWQNPg",
          "id" : 122977,
          "type" : "direct",
          "action" : "cluster:monitor/tasks/lists[n]",
          "start_time" : "2021-02-19T10:40:31.710Z",
          "start_time_in_millis" : 1613731231710,
          "running_time" : "298.7micros",
          "running_time_in_nanos" : 298707,
          "cancellable" : false,
          "parent_task_id" : "xOYwLFnDQvOre0gOnWQNPg:122976",
          "headers" : { }
        },
        "xOYwLFnDQvOre0gOnWQNPg:122976" : {
          "node" : "xOYwLFnDQvOre0gOnWQNPg",
          "id" : 122976,
          "type" : "transport",
          "action" : "cluster:monitor/tasks/lists",
          "start_time" : "2021-02-19T10:40:31.710Z",
          "start_time_in_millis" : 1613731231710,
          "running_time" : "613.6micros",
          "running_time_in_nanos" : 613616,
          "cancellable" : false,
          "headers" : { }
        }
      }
    },
    "_yuKoYXYQp-heg7ZjoOi7w" : {
      "name" : "instance-0000000006",
      "transport_address" : "10.46.24.89:19164",
      "host" : "10.46.24.89",
      "ip" : "10.46.24.89:19164",
      "roles" : [
        "ml",
        "remote_cluster_client"
      ],
      "attributes" : {
        "logical_availability_zone" : "zone-0",
        "server_name" : "instance-0000000006.6a43cf2206664fce853a683f47dfb878",
        "availability_zone" : "westeurope-3",
        "ml.machine_memory" : "1073741824",
        "xpack.installed" : "true",
        "instance_configuration" : "azure.ml.d64sv3",
        "transform.node" : "false",
        "ml.max_open_jobs" : "20",
        "region" : "unknown-region"
      },
      "tasks" : {
        "_yuKoYXYQp-heg7ZjoOi7w:71897" : {
          "node" : "_yuKoYXYQp-heg7ZjoOi7w",
          "id" : 71897,
          "type" : "persistent",
          "action" : "xpack/ml/datafeed[c]",
          "start_time" : "2021-02-19T10:18:21.806Z",
          "start_time_in_millis" : 1613729901806,
          "running_time" : "22.1m",
          "running_time_in_nanos" : 1329905208451,
          "cancellable" : true,
          "parent_task_id" : "cluster:49",
          "headers" : { }
        },
        "_yuKoYXYQp-heg7ZjoOi7w:71992" : {
          "node" : "_yuKoYXYQp-heg7ZjoOi7w",
          "id" : 71992,
          "type" : "persistent",
          "action" : "xpack/ml/datafeed[c]",
          "start_time" : "2021-02-19T10:18:23.326Z",
          "start_time_in_millis" : 1613729903326,
          "running_time" : "22.1m",
          "running_time_in_nanos" : 1328385730898,
          "cancellable" : true,
          "parent_task_id" : "cluster:50",
          "headers" : { }
        },
        "_yuKoYXYQp-heg7ZjoOi7w:82202" : {
          "node" : "_yuKoYXYQp-heg7ZjoOi7w",
          "id" : 82202,
          "type" : "transport",
          "action" : "cluster:monitor/tasks/lists[n]",
          "start_time" : "2021-02-19T10:40:31.711Z",
          "start_time_in_millis" : 1613731231711,
          "running_time" : "105.4micros",
          "running_time_in_nanos" : 105400,
          "cancellable" : false,
          "parent_task_id" : "xOYwLFnDQvOre0gOnWQNPg:122976",
          "headers" : { }
        },
        "_yuKoYXYQp-heg7ZjoOi7w:71807" : {
          "node" : "_yuKoYXYQp-heg7ZjoOi7w",
          "id" : 71807,
          "type" : "persistent",
          "action" : "xpack/ml/job[c]",
          "start_time" : "2021-02-19T10:18:19.933Z",
          "start_time_in_millis" : 1613729899933,
          "running_time" : "22.1m",
          "running_time_in_nanos" : 1331778336769,
          "cancellable" : true,
          "parent_task_id" : "cluster:48",
          "headers" : { }
        },
        "_yuKoYXYQp-heg7ZjoOi7w:71806" : {
          "node" : "_yuKoYXYQp-heg7ZjoOi7w",
          "id" : 71806,
          "type" : "persistent",
          "action" : "xpack/ml/job[c]",
          "start_time" : "2021-02-19T10:18:19.933Z",
          "start_time_in_millis" : 1613729899933,
          "running_time" : "22.1m",
          "running_time_in_nanos" : 1331778384769,
          "cancellable" : true,
          "parent_task_id" : "cluster:47",
          "headers" : { }
        }
      }
    }
  }
}
And the GET /_nodes/hot_threads is a hit-and-miss and nothing useful IMO:
::: {instance-0000000006}{_yuKoYXYQp-heg7ZjoOi7w}{edUv8Mt4TqaQNBpS-X8gEQ}{10.46.24.89}{10.46.24.89:19164}{lr}{logical_availability_zone=zone-0, server_name=instance-0000000006.6a43cf2206664fce853a683f47dfb878, availability_zone=westeurope-3, ml.machine_memory=1073741824, xpack.installed=true, instance_configuration=azure.ml.d64sv3, transform.node=false, ml.max_open_jobs=20, region=unknown-region}
   Hot threads at 2021-02-19T10:43:21.522Z, interval=500ms, busiestThreads=3, ignoreIdleThreads=true:

::: {instance-0000000005}{xOYwLFnDQvOre0gOnWQNPg}{axeTq0lATBaEHajePQZbAQ}{10.46.24.70}{10.46.24.70:19941}{cdhimrstw}{logical_availability_zone=zone-0, server_name=instance-0000000005.6a43cf2206664fce853a683f47dfb878, availability_zone=westeurope-3, xpack.installed=true, instance_configuration=azure.data.highio.l32sv2, transform.node=true, region=unknown-region}
   Hot threads at 2021-02-19T10:43:21.521Z, interval=500ms, busiestThreads=3, ignoreIdleThreads=true:

   20.6% (103.2ms out of 500ms) cpu usage by thread 'elasticsearch[instance-0000000005][management][T#5]'
     3/10 snapshots sharing following 18 elements
       app//org.elasticsearch.action.admin.cluster.stats.MappingVisitor.visitMapping(MappingVisitor.java:40)
       app//org.elasticsearch.action.admin.cluster.stats.MappingVisitor.visitMapping(MappingVisitor.java:40)
       app//org.elasticsearch.action.admin.cluster.stats.MappingVisitor.visitMapping(MappingVisitor.java:40)
       app//org.elasticsearch.action.admin.cluster.stats.MappingStats.of(MappingStats.java:58)
       app//org.elasticsearch.action.admin.cluster.stats.ClusterStatsResponse.<init>(ClusterStatsResponse.java:78)
       app//org.elasticsearch.action.admin.cluster.stats.TransportClusterStatsAction.newResponse(TransportClusterStatsAction.java:83)
       app//org.elasticsearch.action.admin.cluster.stats.TransportClusterStatsAction.newResponse(TransportClusterStatsAction.java:54)
       app//org.elasticsearch.action.support.nodes.TransportNodesAction.newResponse(TransportNodesAction.java:137)
       app//org.elasticsearch.action.support.nodes.TransportNodesAction$AsyncAction.lambda$finishHim$1(TransportNodesAction.java:263)
       app//org.elasticsearch.action.support.nodes.TransportNodesAction$AsyncAction$$Lambda$5146/0x000000080189cba8.get(Unknown Source)
       app//org.elasticsearch.action.ActionRunnable.lambda$supply$0(ActionRunnable.java:58)
       app//org.elasticsearch.action.ActionRunnable$$Lambda$5147/0x000000080189cdd0.accept(Unknown Source)
       app//org.elasticsearch.action.ActionRunnable$2.doRun(ActionRunnable.java:73)
       app//org.elasticsearch.common.util.concurrent.ThreadContext$ContextPreservingAbstractRunnable.doRun(ThreadContext.java:737)
       app//org.elasticsearch.common.util.concurrent.AbstractRunnable.run(AbstractRunnable.java:37)
       java.base@15.0.1/java.util.concurrent.ThreadPoolExecutor.runWorker(ThreadPoolExecutor.java:1130)
       java.base@15.0.1/java.util.concurrent.ThreadPoolExecutor$Worker.run(ThreadPoolExecutor.java:630)
       java.base@15.0.1/java.lang.Thread.run(Thread.java:832)
     7/10 snapshots sharing following 15 elements
       app//org.elasticsearch.action.admin.cluster.stats.MappingStats.of(MappingStats.java:58)
       app//org.elasticsearch.action.admin.cluster.stats.ClusterStatsResponse.<init>(ClusterStatsResponse.java:78)
       app//org.elasticsearch.action.admin.cluster.stats.TransportClusterStatsAction.newResponse(TransportClusterStatsAction.java:83)
       app//org.elasticsearch.action.admin.cluster.stats.TransportClusterStatsAction.newResponse(TransportClusterStatsAction.java:54)
       app//org.elasticsearch.action.support.nodes.TransportNodesAction.newResponse(TransportNodesAction.java:137)
       app//org.elasticsearch.action.support.nodes.TransportNodesAction$AsyncAction.lambda$finishHim$1(TransportNodesAction.java:263)
       app//org.elasticsearch.action.support.nodes.TransportNodesAction$AsyncAction$$Lambda$5146/0x000000080189cba8.get(Unknown Source)
       app//org.elasticsearch.action.ActionRunnable.lambda$supply$0(ActionRunnable.java:58)
       app//org.elasticsearch.action.ActionRunnable$$Lambda$5147/0x000000080189cdd0.accept(Unknown Source)
       app//org.elasticsearch.action.ActionRunnable$2.doRun(ActionRunnable.java:73)
       app//org.elasticsearch.common.util.concurrent.ThreadContext$ContextPreservingAbstractRunnable.doRun(ThreadContext.java:737)
       app//org.elasticsearch.common.util.concurrent.AbstractRunnable.run(AbstractRunnable.java:37)
       java.base@15.0.1/java.util.concurrent.ThreadPoolExecutor.runWorker(ThreadPoolExecutor.java:1130)
       java.base@15.0.1/java.util.concurrent.ThreadPoolExecutor$Worker.run(ThreadPoolExecutor.java:630)
       java.base@15.0.1/java.lang.Thread.run(Thread.java:832)
These are the GET /_cluster/settings:
{
  "persistent" : {
    "action" : {
      "auto_create_index" : ".ent-search-*-logs-*,-.ent-search-*,+*"
    },
    "cluster" : {
      "routing" : {
        "allocation" : {
          "disk" : {
            "threshold_enabled" : "true"
          }
        }
      },
      "indices" : {
        "close" : {
          "enable" : "true"
        }
      },
      "metadata" : {
        "display_name" : "koco-robot"
      }
    },
    "slm" : {
      "retention_schedule" : "0 20,50 * * * ?"
    },
    "snapshot" : {
      "max_concurrent_operations" : "1"
    },
    "xpack" : {
      "monitoring" : {
        "collection" : {
          "enabled" : "true",
          "interval" : "60s"
        },
        "exporters" : {
          "__no-default-local__" : {
            "type" : "local",
            "enabled" : "false"
          },
          "found-user-defined" : {
            "type" : "local",
            "enabled" : "true"
          }
        }
      },
      "ml" : {
        "max_model_memory_limit" : "315MB",
        "max_machine_memory_percent" : "41"
      }
    }
  },
  "transient" : {
    "cluster" : {
      "routing" : {
        "allocation" : {
          "enable" : "all"
        }
      }
    }
  }
}