Hi all,
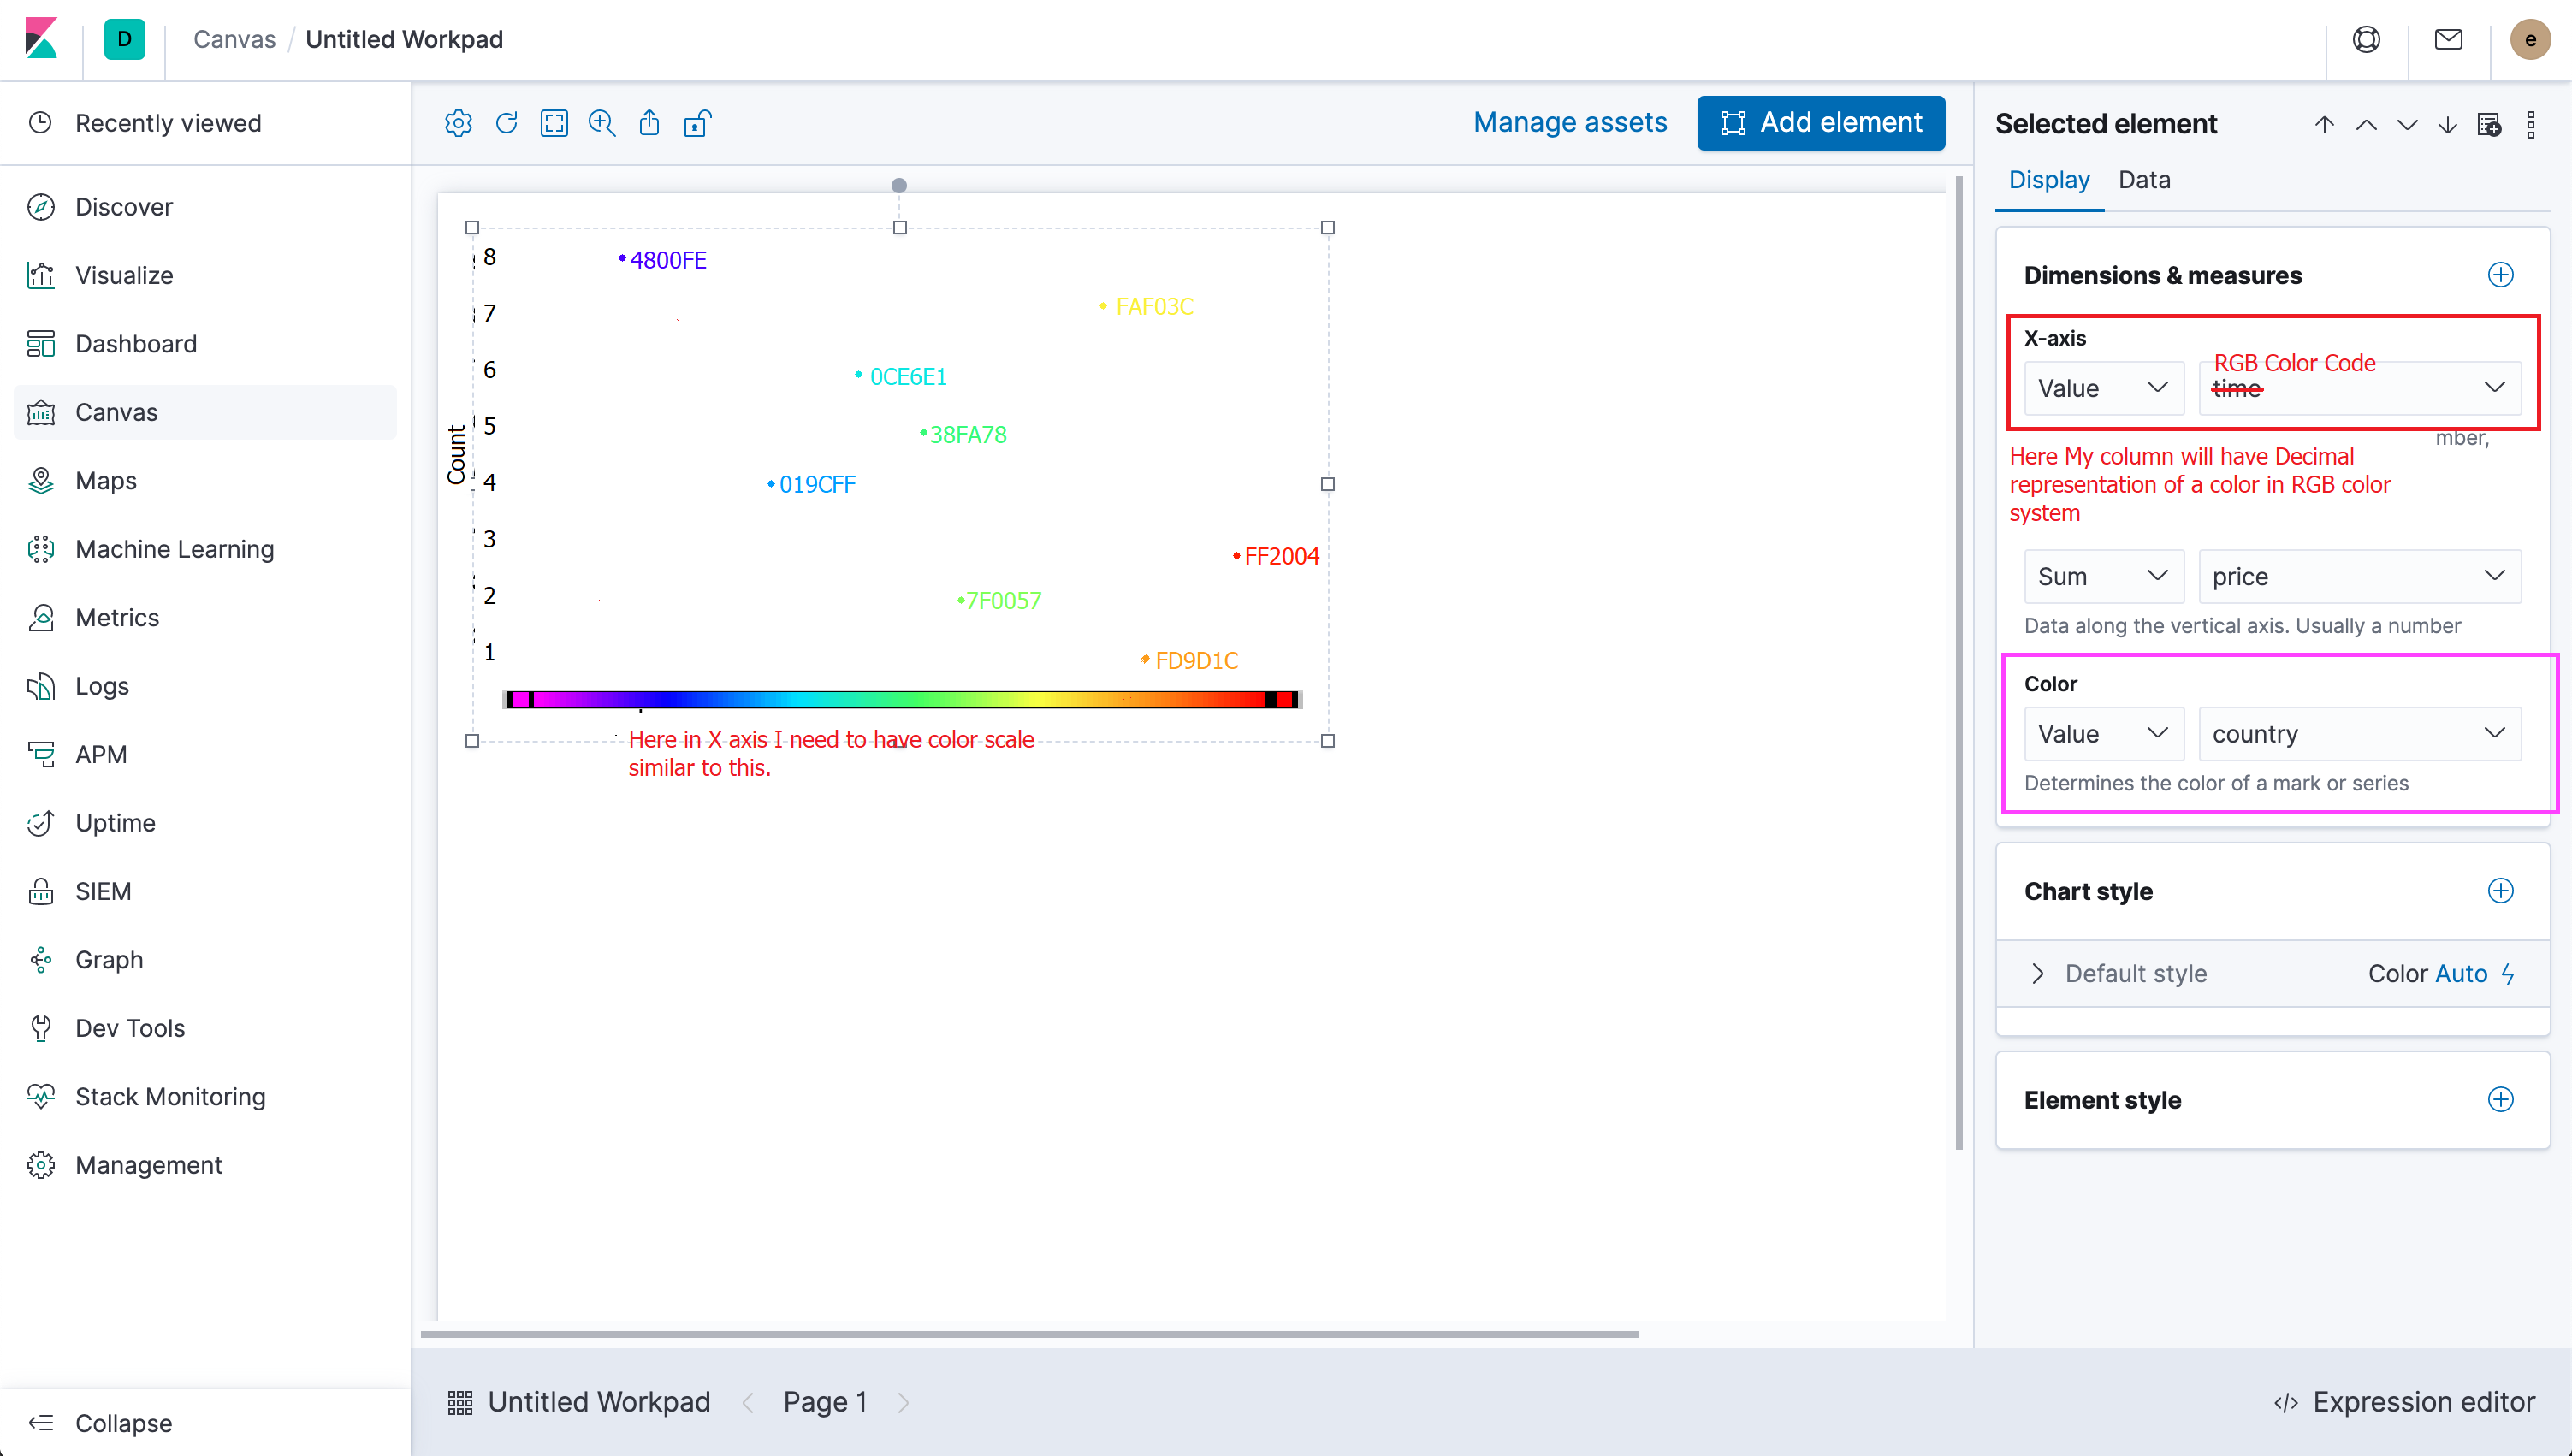
I want to create a chart that has a gradient X axis that gets start from black till white that includes all possible RGB combination.
So for each iteration I will get one color code which I need to plot against the X axis color scale.
Hi all,
I want to create a chart that has a gradient X axis that gets start from black till white that includes all possible RGB combination.
So for each iteration I will get one color code which I need to plot against the X axis color scale.
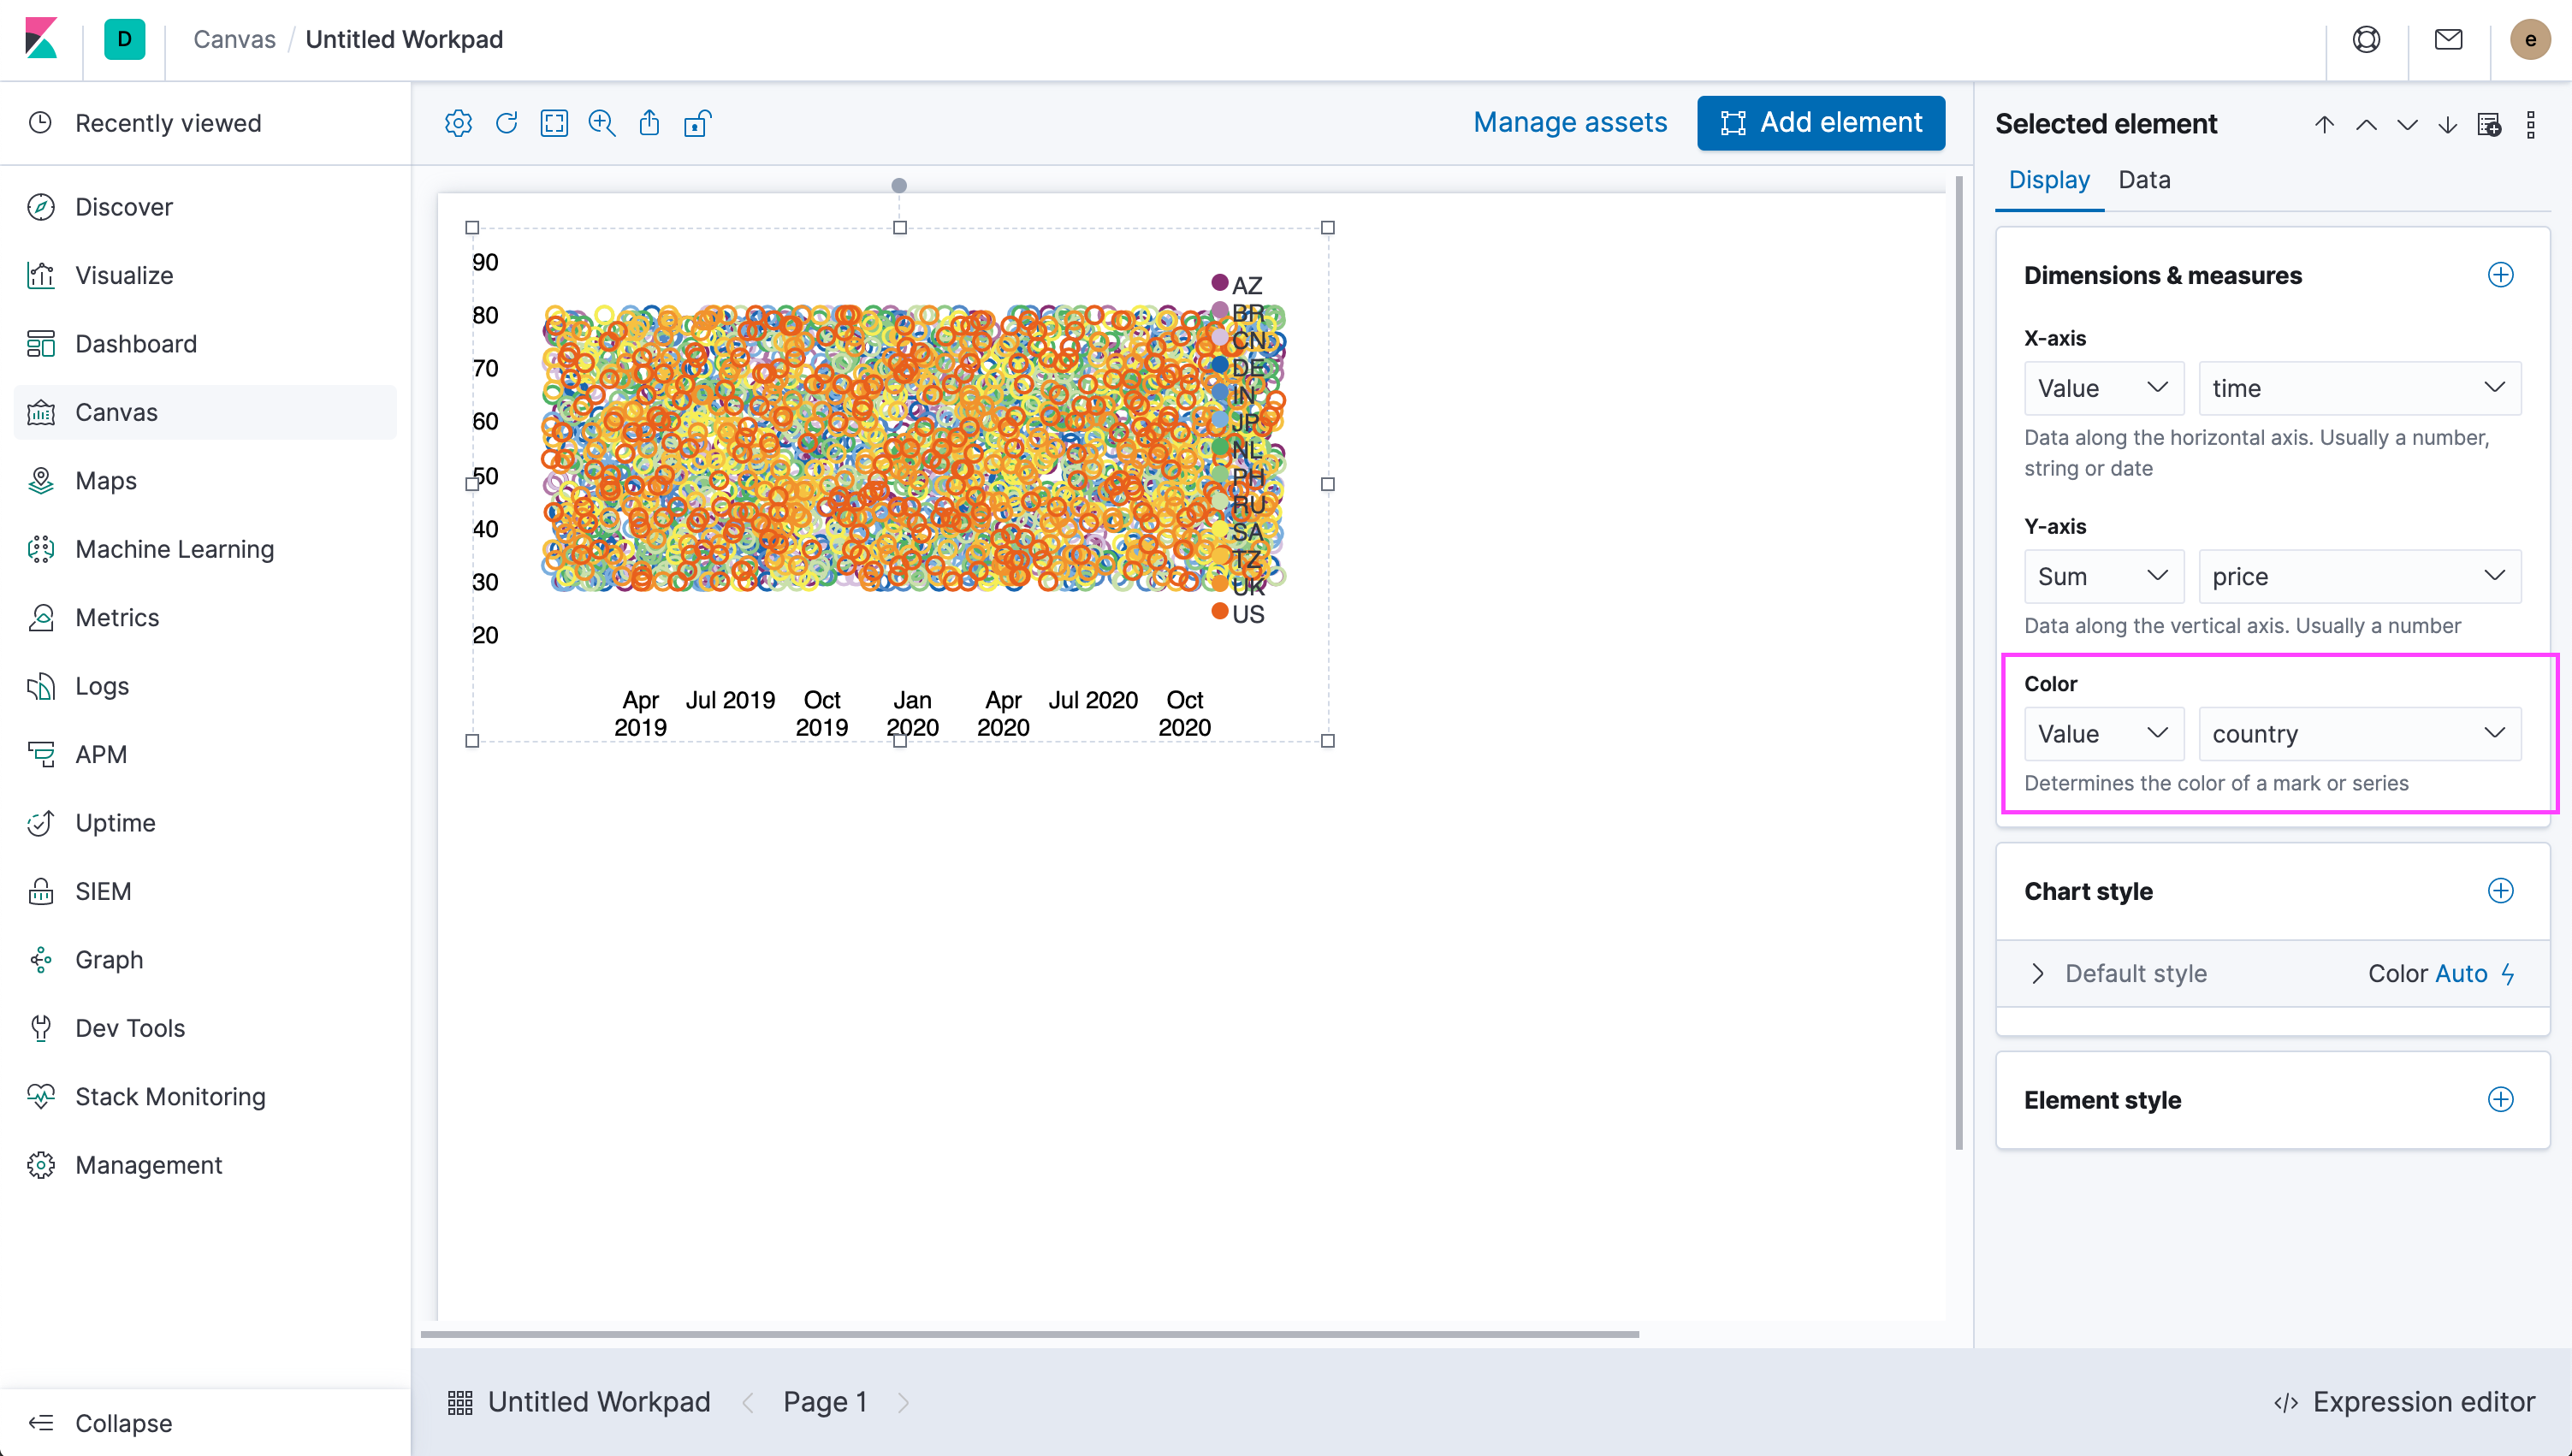
Hey @Yegammai_GK, I'm not exactly sure what you'd ideally like to accomplish. The Canvas application allows you to specify the color data-points based on the data itself:
© 2020. All Rights Reserved - Elasticsearch
Apache, Apache Lucene, Apache Hadoop, Hadoop, HDFS and the yellow elephant logo are trademarks of the Apache Software Foundation in the United States and/or other countries.