kibana dashboard seems to show cpu usage changes on increments(i'm using metricbeat to ship system metrics). How do I configure the dashboard to project cpu usage on a real time basis.
Hi @Ritzy,
Welcome to the Elastic community.
I'm not sure I understand your scenario. Would you mind elaborating a bit, perhaps using some sample data as to what you are seeing vs. what you would like to see?
Thanks,
Shaunak
Hi Shaunak,
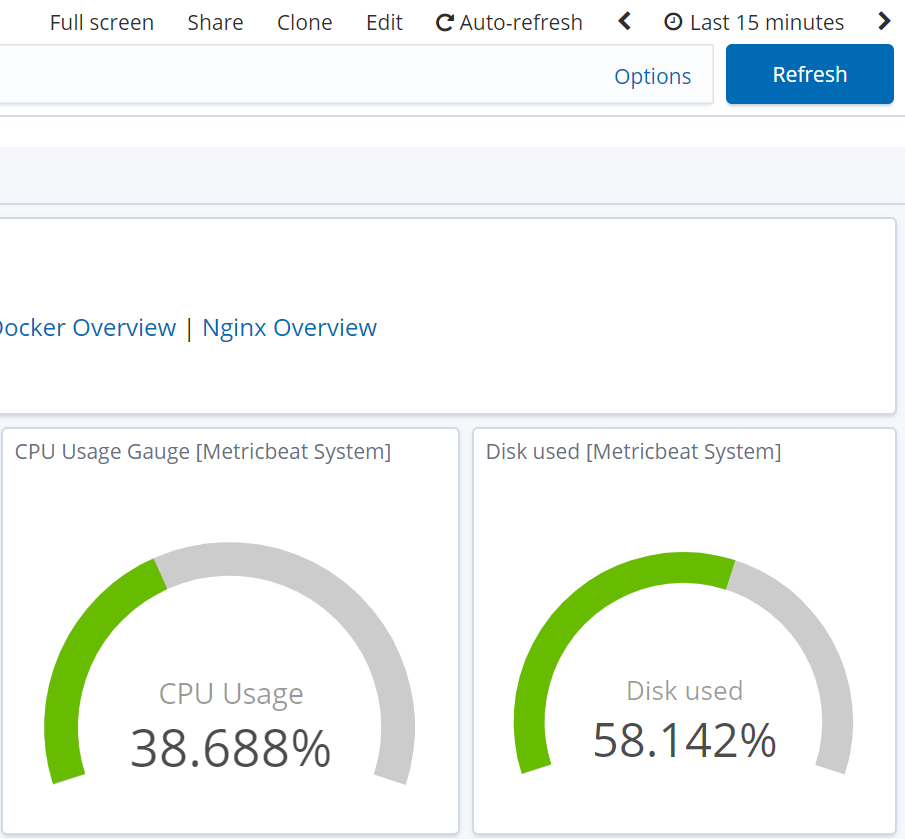
Thank you for having me. I have not been able to view metricbeat data on kibana dashboard under "Today" timeline.

but under last 15 minutes or any other timeline, I am able to view the data.
my system.yml config is as below
module: system
period: 10s
metricsets:
- cpu
- load
- memory
- network
- process
- process_summary
- core
- diskio
#- socket
processes: ['.*']
process.include_top_n:
by_cpu: 5 # include top 5 processes by CPU
by_memory: 5 # include top 5 processes by memory
-
module: system
period: 10s
metricsets:- filesystem
- fsstat
processors: - drop_event.when.regexp:
system.filesystem.mount_point: '^/(sys|cgroup|proc|dev|etc|host|lib)($|/)'
-
module: system
period: 15m
metricsets:- uptime
Thanks,
Ritz
