Hi everyone,
I am trying to build a time series visual builder using a realtime database. The thing is, when I try to put up to 4 data series ( And even with 2 ) with two distinct physical units hence with two scales on on the right the other on the left, I toggle the " Separated axis " field but it seems like I can't make the scales to adapt themselves with the data values put in the metric field. If I fill in the axis min and axis max fields my issue disappear but since the aim for this chart is to display realtime data one cannot predict what values would be taken a month or even a year from now this is why I would like to avoid having to put bound values myself.
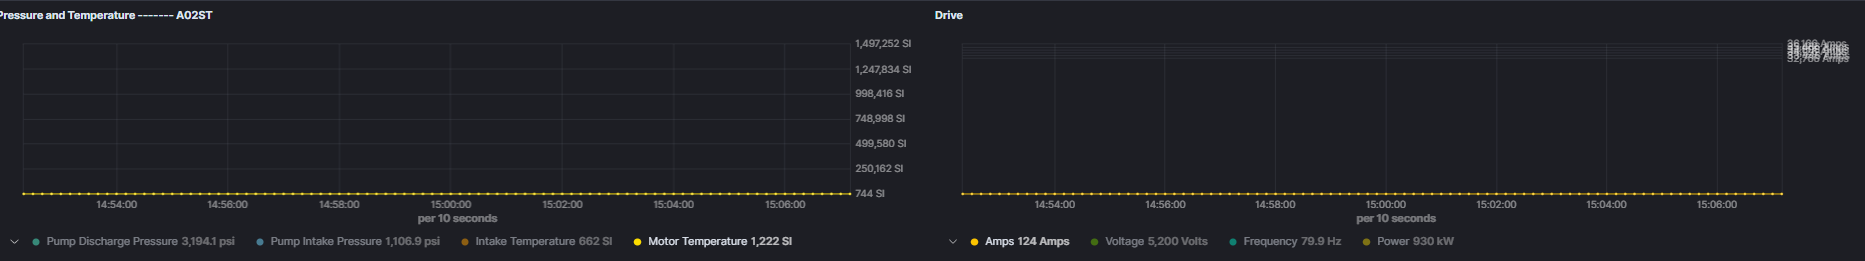
Here is the issue itself :
- In a dashboard or in the visualization tool, when all the curves are displayed the scale seems fine

- when I select a certain metric to see only the curve interesting me the scale shows something utterly weird ( in one situation the scale is "only" not adapted, in other cases a stack of " scale innformation" appears int the upper right corner of the visual builder.

Is there something that would allow me to separate the axis by keeping an autoscaling feature ? and even more, is it possible to separated the axis and put it on the right side along with an other metric that would use the same scale as the metric on the right but not on the left ?
thank you for your answer