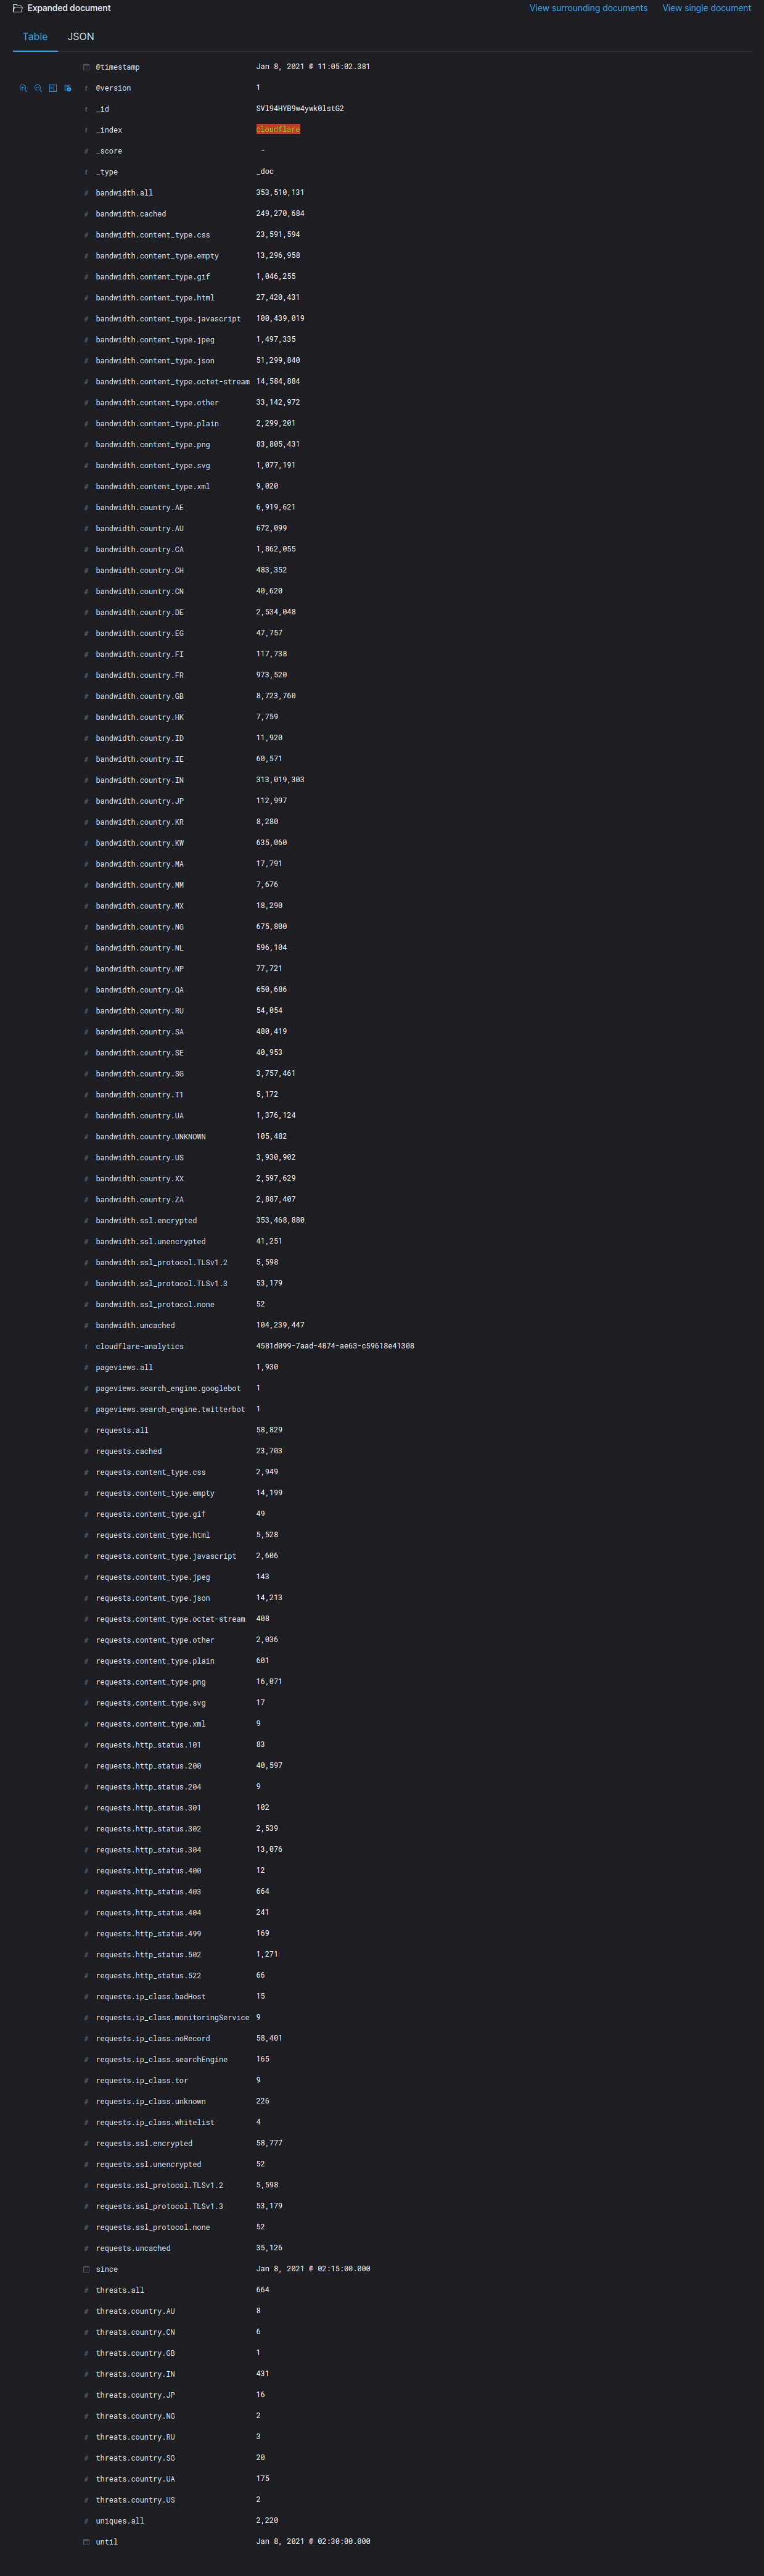
I have few hundreds of events having Cloudflare analytics data. For example, I want to show a line chart for bandwidth increasing and decreasing on certain dates. Cloudflare already giving the total count for each field(e.g bandwidth.all , bandwidth.cached) I am fetching a new event every 15 minutes.
Also, I am happy to accept suggestions on what other visualization I can create for such data.
When you create the line chart, you will need to pick a metric aggregation type (avg, min, max, sum, etc) and a field to use in calculating the metric. The chart will have dots where the metric values are, with lines connecting the dots.
It might be useful to you to see the min, avg, and max metrics of bandwidth.all over time. You can create that line chart in Lens.
Looking at this in Kibana 7.10:
From the side navigation bar, click Visualize and then "Create visualization". Under " Select a visualization type", click "Go to Lens".
In Lens, choose the data source from the index pattern dropdown, and pick a time range that displays enough data to work with. Lens will then show a list of fields in the left sidebar.
In the Chart Type picker, choose "Line" as the type of chart. The default is bar chart.
Drag the bandwidth.all field into the preview area. By default, the average metric is selected. Lens will show you a line for average of bandwidth.all in the chart.
For the min and max metrics, click "Drop a field or click to add" on the right-hand sidebar under Y-Axis. Select bandwidth.all and change the metric type to min and max as needed.
You can customize the time interval by clicking the date field under "X-Axis" in the right-hand sidebar.
Apache, Apache Lucene, Apache Hadoop, Hadoop, HDFS and the yellow elephant
logo are trademarks of the
Apache Software Foundation
in the United States and/or other countries.