In so many YouTube videos about Kibana I see very nice dashboards.
Line Charts with a grid in the background, Pie and donut charts with values and spark charts. Clean panels with a border and a very structured design. Nothing that I can do with Kibana 5.0. Am I missing something here ? Or was the last upgrade a downgrade in spite of functionality ?
Yes, you are right. Kibana 5.0 does have some missing functionality. Specially when it comes to visualization options at this time we are still lagging behind, but we are actively working on getting there. Hopefully in the future Kibana will not just offer what previous versions did but much more.
But on the other hand 5.0 version did bring many new features and many improvements over the previous versions. Some of them are mentioned in our blog post.
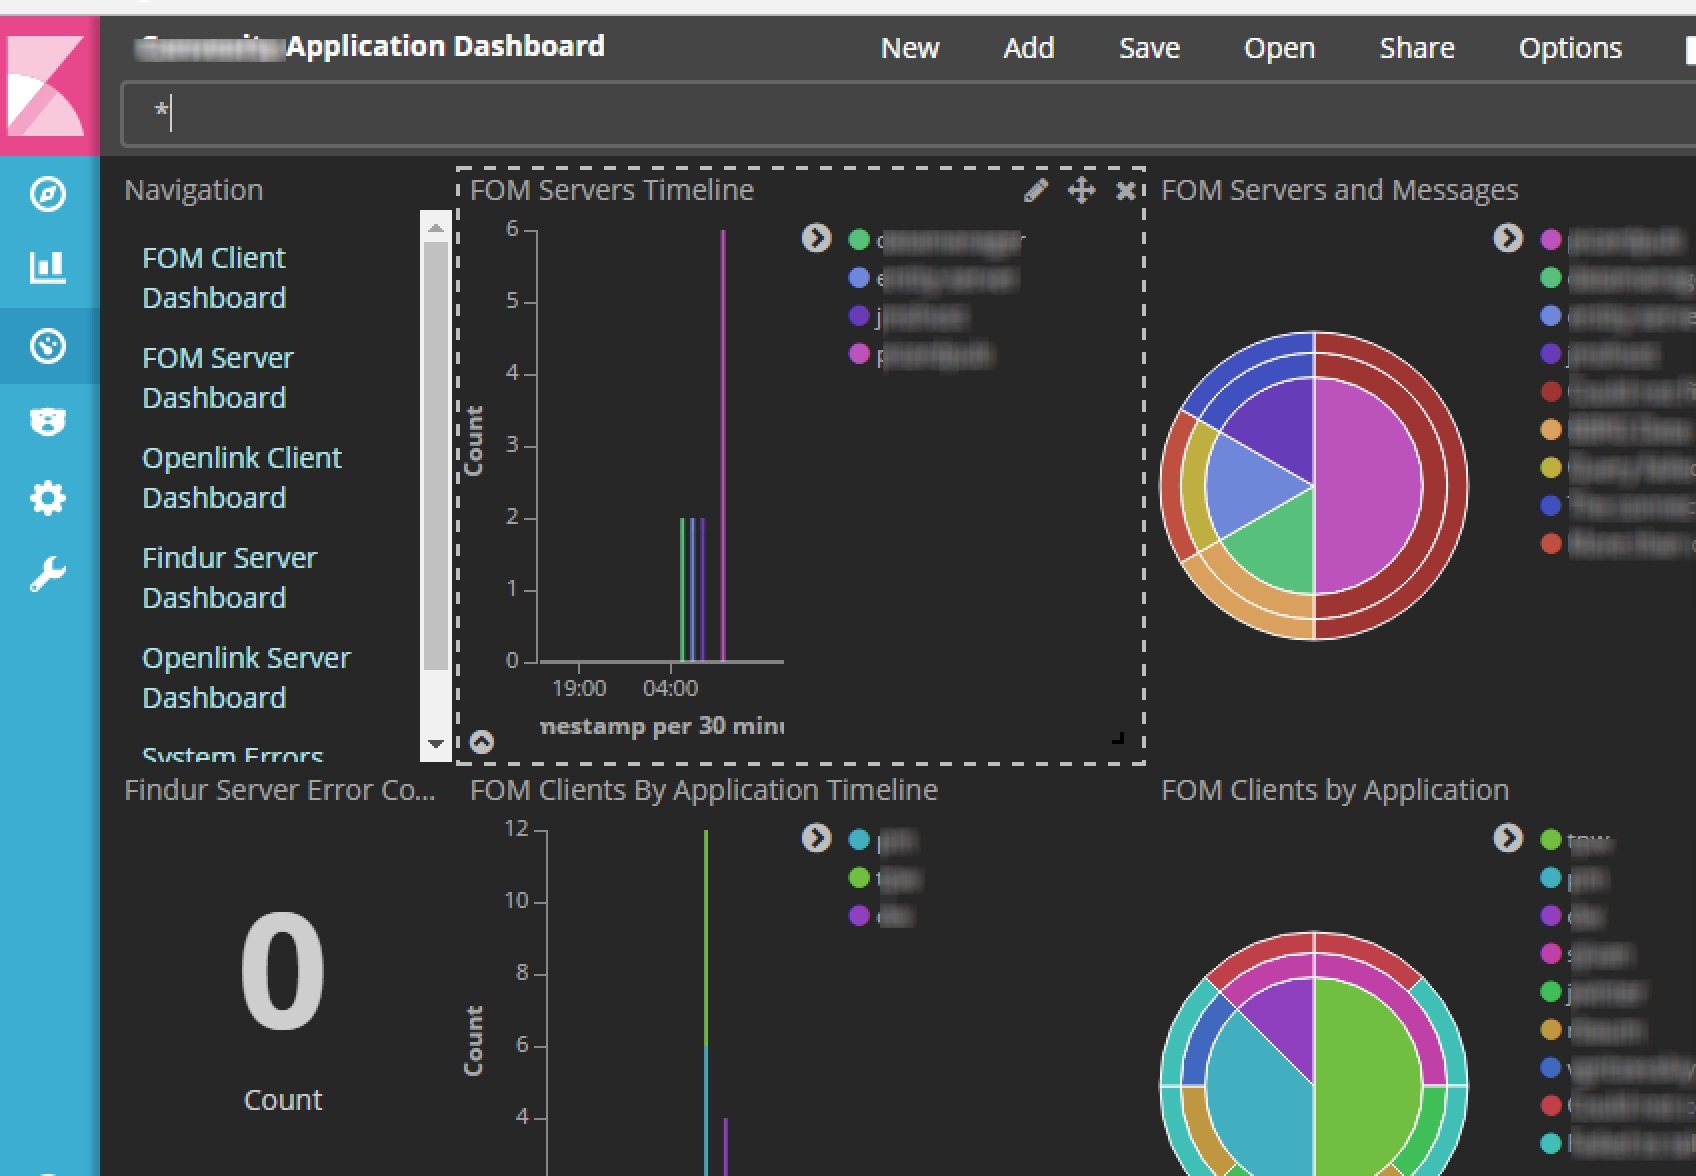
I just upgraded from Kibana 4 to 5 and was quite disappointed by the new L&F of the dashboard. The dark theme especially looks very ordinary compared to the sharp look with borders around each visualization that was in Kibana 4.0. It's also pretty annoying / distracting to see the dotted borders around each visualization upon doing a mouse over giving the appearance of the dashboards being in development / edit mode rather than something presented as an end deliverable.
I see that the blog announcement specifically mentions that the removal of borders around each visualization as an improvement (Kibana 5.0.0 released | Elastic Blog)
Oh, and we got rid of those stupid borders. You know the ones we’re talking about. Seriously, who puts borders on widgets in a dashboard? Not us… anymore.
Not sure how others feel but the new UI looks like a step back to me as well. Additionally the collapsed side nav always being visible is also rather distracting and has a color that does not match with the dark theme. Is there an option for a full screen mode for the dashboard alone?
Feel the same way, the dotted borders are kinda annoying. And I don't understand the removal of the olf borders either, makes it kinda harder to read the entier dashoard
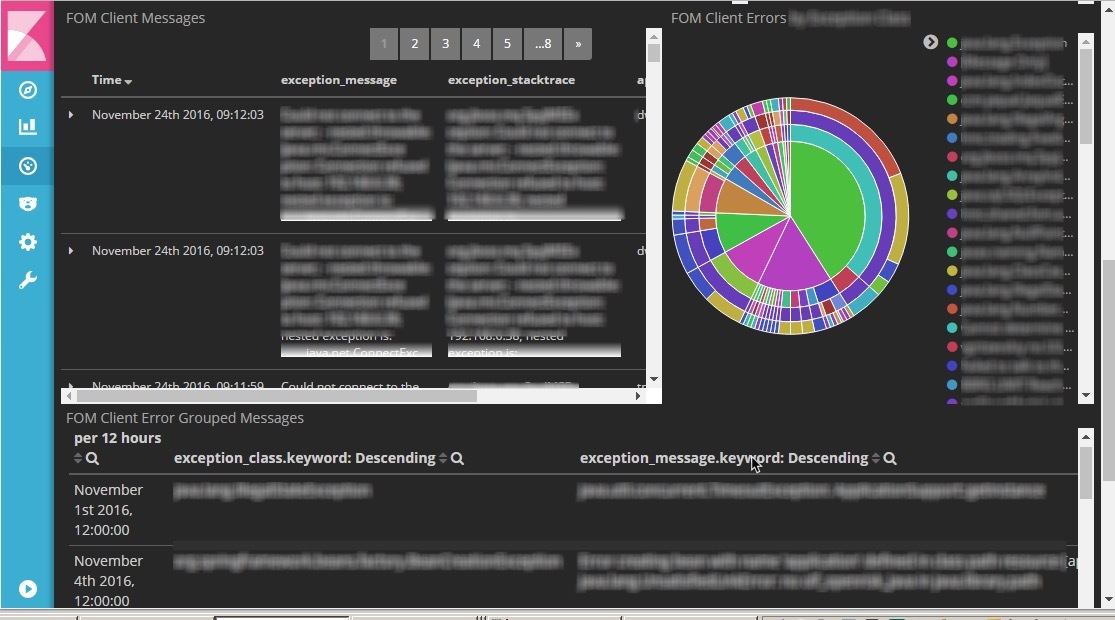
Here are some of the Kibana 4 vs 5 screenshots for comparison. Data tables are another area where the lack of borders make it harder to view in the context of a dashboard with other visualizations. The default fonts in the markup widget in Kibana 5 are different and not as compact.
The longer I'm working with the 'new' Version, the more I'm disappointed.
I quite like the TimeLion, but the dashboard is for sure not usable for me and unfortunately I have to confirm all the criticism of my previous speakers.
I started to look for an alternative and found Grafana. Unfortunately they don't support Elastic 5 at the moment, but I had a chat with the developer and they are working on this after the final release of the version 4.0 which is in Beta at the moment. But maybe already at the end of December a first version with Elastic 5 support will be available. I'm really looking forward to that version as this will give me all I need and way more options than Kibana is offering right now.
What I am missing since kibana 3 are container. There is no nice way (I know about) to group visualizations, e.g. several metrics. Moving stuff around can become quite cumbersome. Container would be really a feature I'd like to have back. And Kibana 3 style table panel, simply displaying logs line by line was way nicer than a search panel today.
But I really like lots of the functional features kibana 5 is offering, timelion for instance is a real plus! I am sure visualization will improve, so bring on the next releases
The issue you point to is Kibana 3 vs 4 and some new feature requests. This thread is specifically about the Kibana 5 UI being a step back from the Kibana 4 UI.
I'll log a feature request pointing to this thread.
Apache, Apache Lucene, Apache Hadoop, Hadoop, HDFS and the yellow elephant
logo are trademarks of the
Apache Software Foundation
in the United States and/or other countries.