Hi there,
I would like to seek your help with regard to kibana visualizations.

Above shows a sample list of data & screenshot given by the end user of its expected outcome for the data uploaded into elasticsearch. The results are not logged regularly (ie no expected interval) but user will just require a display of latest test result per app code.
The alphabets are "app code". If result for the test shows "fail", the app code will be displayed in red highlighted cell. If result shows "pass", the app code will be displayed in green highlighted cell.
I have tried replicating them in simple kibana table visualization with the help of colour coding at Index Patterns for "result" field, but the display isn't what the users desired.
Instead, my supervisor suggested to use kibana canvas. Upon doing some research, I have some unanswered queries that would like to seek your expert advises.
-
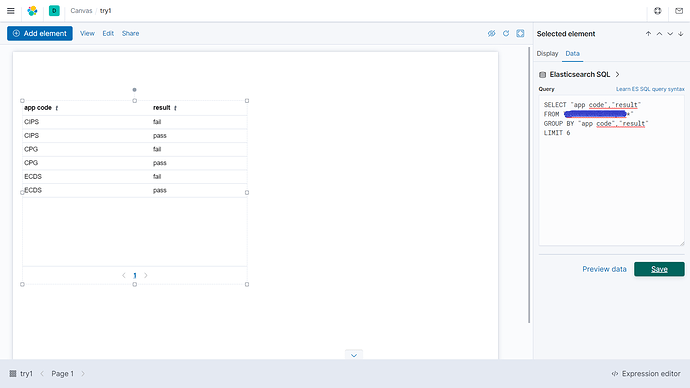
My current SQL query result shows 1 pass 1 fail each from every app code. Is there a way to display just the latest result of each app code, regardless of pass/fail? My understanding of SQL is that it will be doable with innerjoin tables, but seems like kibana canvas does not have such function?
-
As user requires colour coding of pass/fail, I cannot find a way to enter the colours according to the text shown. Only way is via "Display" > "Text settings", which changes the font colour of the entire table.
Appreciate your help much. Thank you! 


