Hi There,
I'm running on elk 7.9.2 with two kibana's nodes.
I'm noticing some interesting behaviour in the stack monitoring


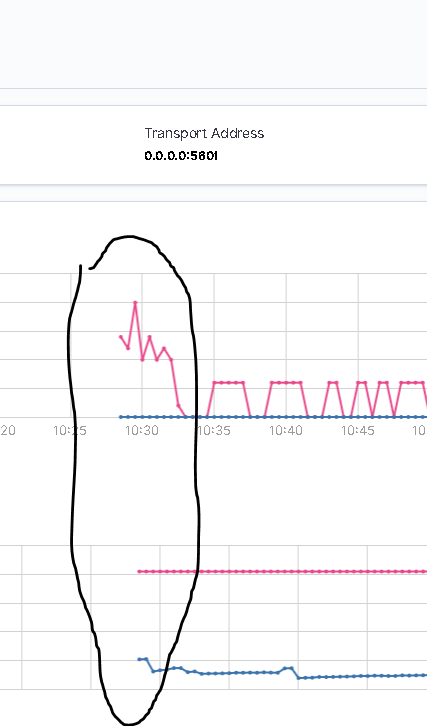
When I reboot one of two kibana's node then I've lost my monitoring graphs and I start from the beginning (see snapshots)
Is this because I haven't linked some persisten volume ?
See my kibana.yml and docker-compose.yml (they are same for both nodes)
kibana.yml
server.port: 5601
server.host: "0.0.0.0"
server.name: "kib01d"
elasticsearch.hosts: ["https://xxx:9200","https://xxx:9200","https://xxx:9200"]
server.ssl.enabled: true
elasticsearch.username: "kibana_system"
elasticsearch.password: "xxx"

server.ssl.certificate: /usr/share/kibana/config/certs/xxx.crt
server.ssl.key: /usr/share/kibana/config/certs/xxx.key

elasticsearch.ssl.certificateAuthorities: [ "/usr/share/kibana/config/certs/ca/ca.crt" ]

elasticsearch.ssl.verificationMode: certificate

pid.file: /usr/share/kibana/kibana.pid
logging.verbose: true
logging.dest: /usr/share/kibana/logs/kibana.log
xpack.security.encryptionKey: "xxx"
xpack.encryptedSavedObjects.encryptionKey: "xxx"
#xpack.monitoring.collection.enabled: true
xpack.ml.enabled: true
telemetry.enabled: false
docker-compose.yml:
version: '3'
services:
  kib01d:
    image: /elk/kibana/kibana:7.9.2
    container_name: kib01d
    environment:
      - bootstrap.memory_lock=true
      - publish-all
      - ES_JAVA_OPTS="-Xms16G -Xmx16G"
    ulimits:
      memlock:
        soft: -1
        hard: -1
    volumes:
      - /srv/Docker/config:/usr/share/kibana/config
      - /srv/Docker/logs:/usr/share/kibana/logs
    dns:

    dns_search: xxx.xx
    ports:
      - 5601:5601
    network_mode: "host"
  metricbeats:
    image: harbor.upc.pl/elk/beats/metricbeat:7.9.2
    container_name: metricbeat05
    environment:
       - publish-all
    user: root
    depends_on:
      - kib01d
    command: metricbeat -e -E name=MB_Kibana_1
    volumes:
      - "/srv/Docker/metricbeat/metricbeat.yml:/usr/share/metricbeat/metricbeat.yml:ro"
      - "/var/run/docker.sock:/var/run/docker.sock:ro"
      - "/srv/Docker/metricbeat/modules.d:/usr/share/metricbeat/modules.d"
      - "/sys/fs/cgroup:/hostfs/sys/fs/cgroup:ro"
      - "/proc:/hostfs/proc:ro"
      - "/:/hostfs:ro"
      - "/srv/Docker/config:/usr/share/kibana/config"
Any ideas ?