Hello,
I have a problem with Wazuh and kibana interface. I can not see any graph in several places like wazuh -> overview -> security events:

Or wazuh -> agents -> security events:
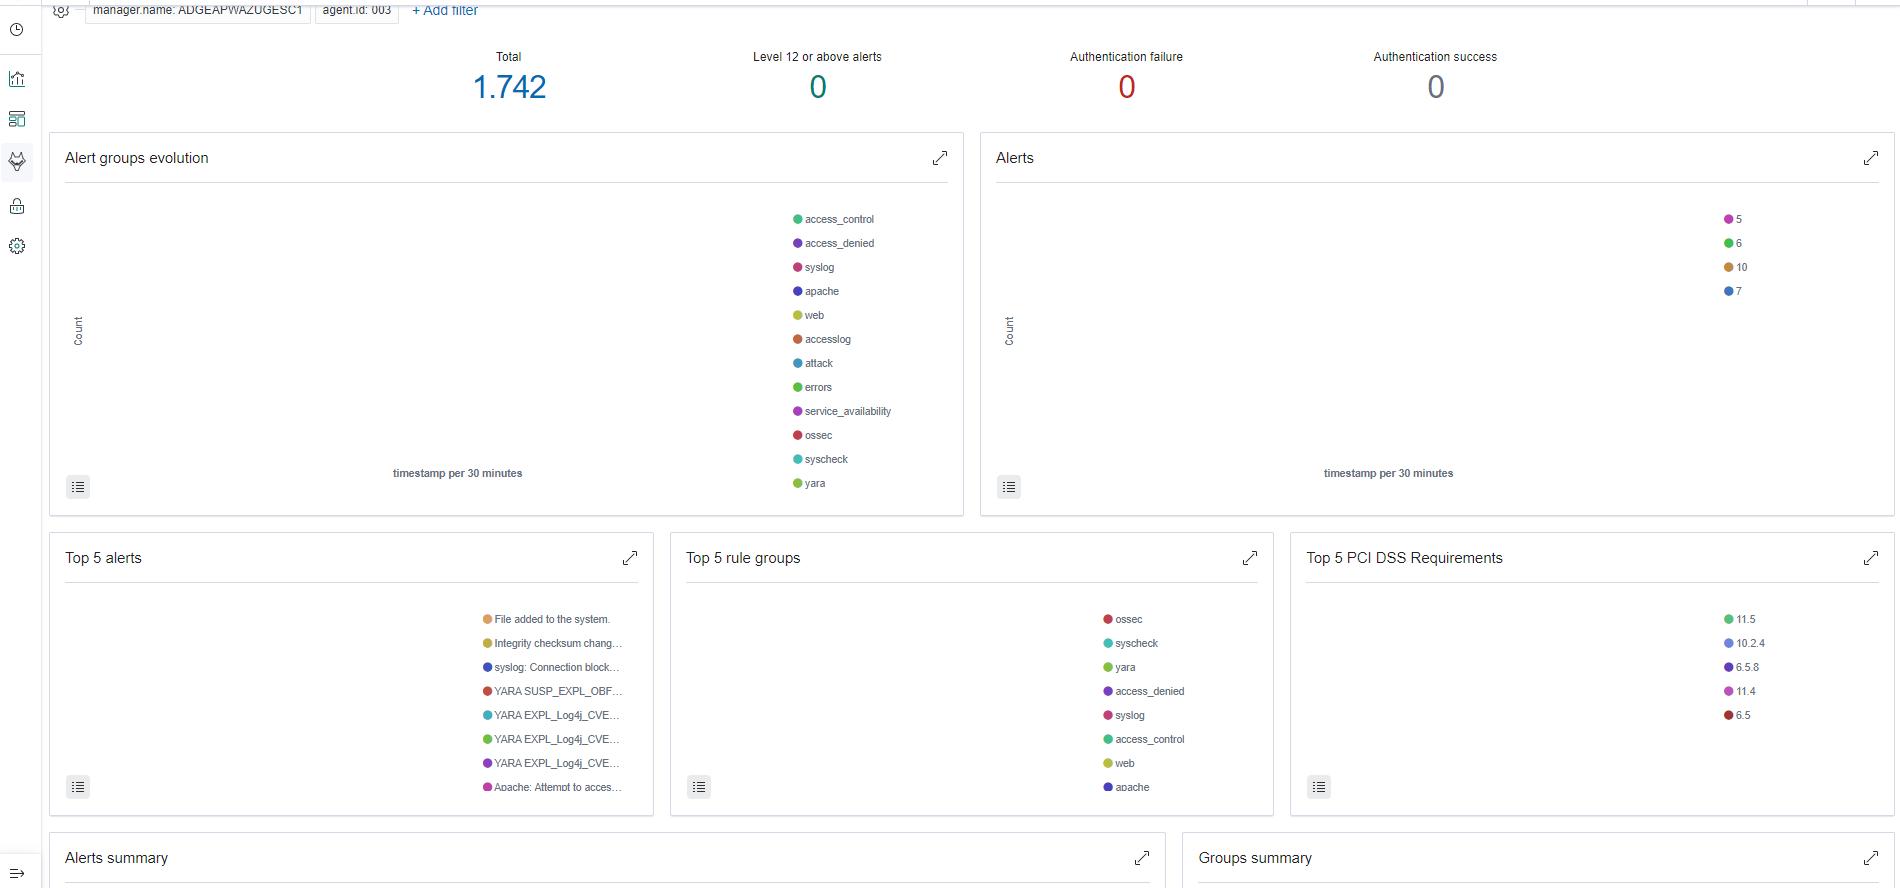
Or in general in any visualization.
I tried restart kibana, wazuh-manager and Elasticsearch without success, also tried to reboot the server.
the same thing happens with other browsers.
Anyone know what is the problem?
I think that this happenes when i did a Auditbeat setup.
Thank you for your help.