Kibana histogram chart

Hi, this pic is an example in "metabase". It shows busiest hours of the day and the best-selling day of week in a month for example.

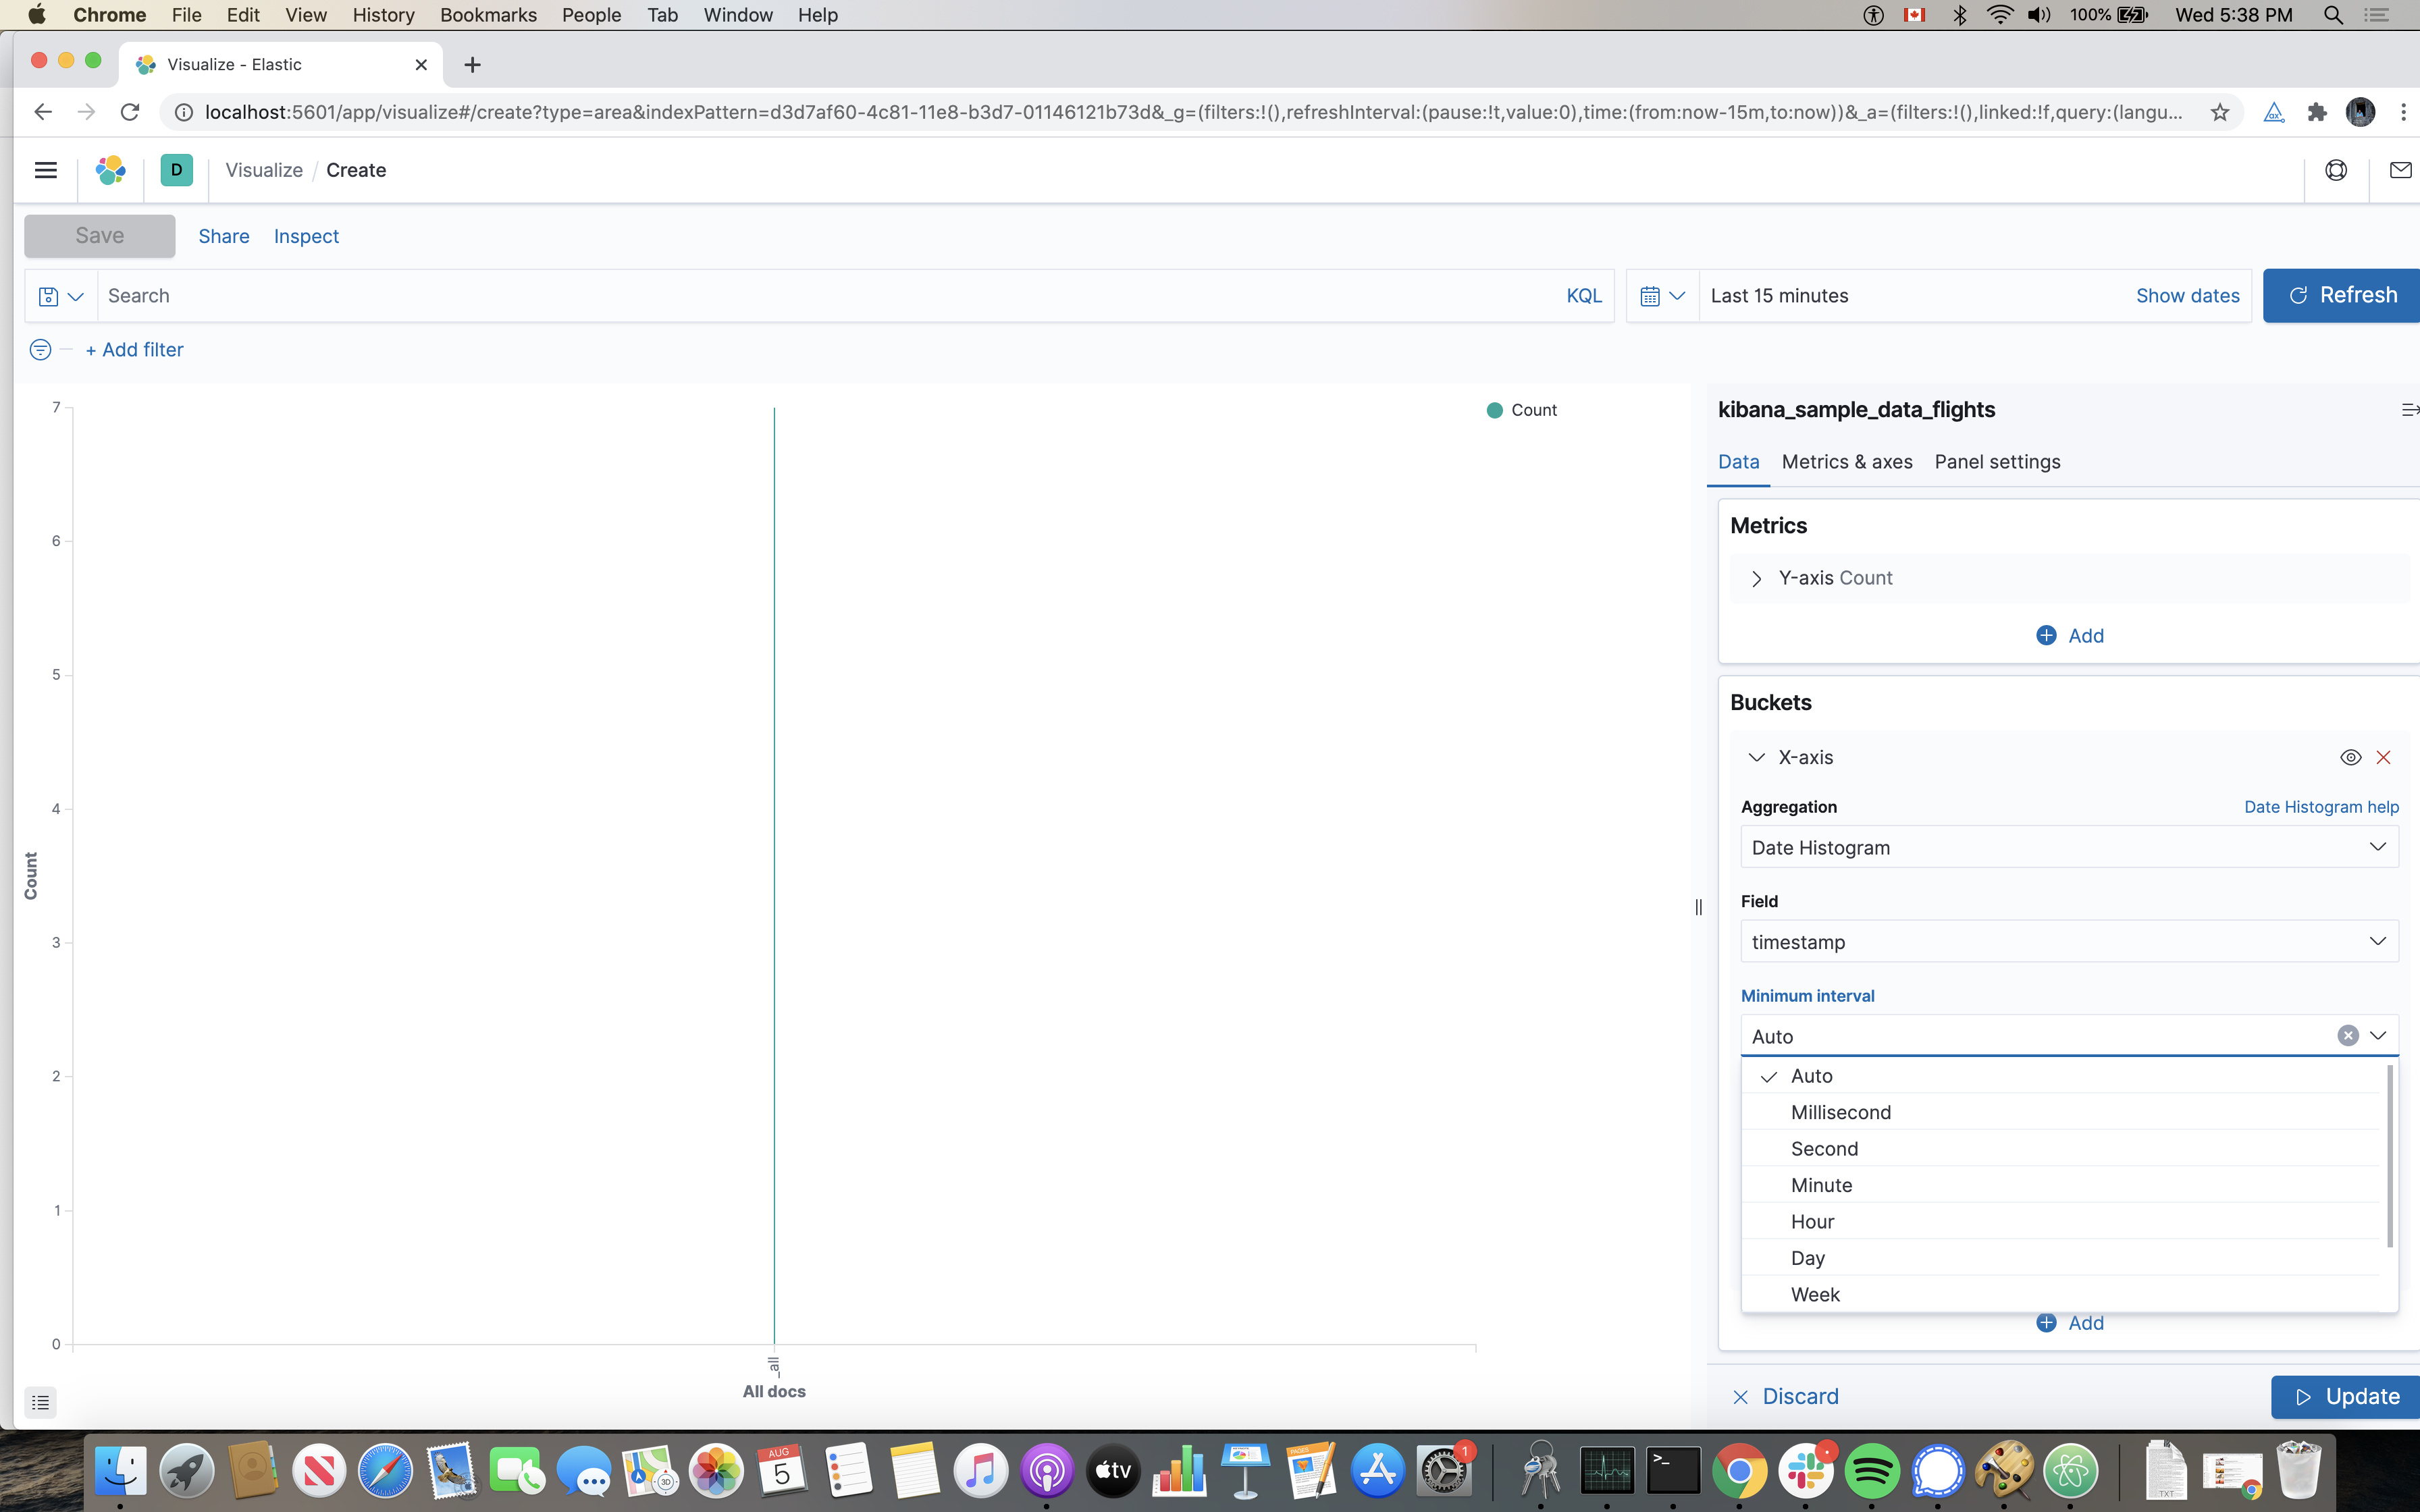
I know I can create a line chart like this in kibana

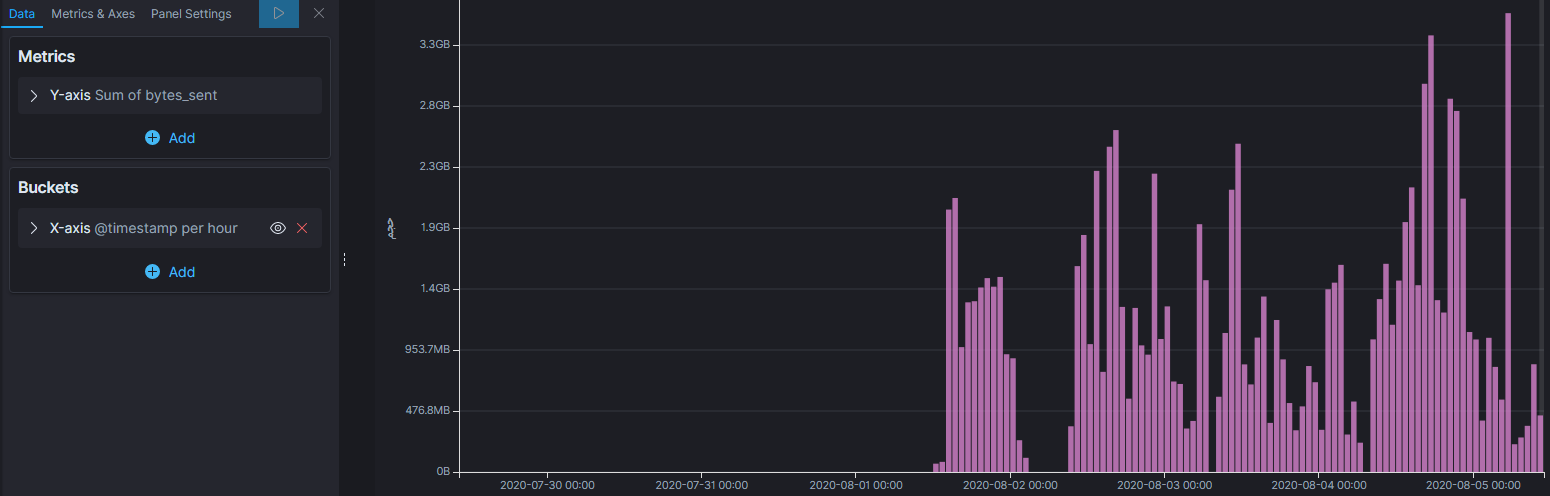
But it shows the busiest hours "per day".
I need something like metabase chart but in Kibana. Is it possible ?
thanx a lot

Hello,

You can change the timestamp by hour to what you would like in the visualize editor.


Looking at Time series visual builder should also help because you can do annotations there using queries.

There are three part videos on this ^

Thanks
Bhavya

This topic was automatically closed 28 days after the last reply. New replies are no longer allowed.