Installing X-Pack now ... will update in 10 min
OK
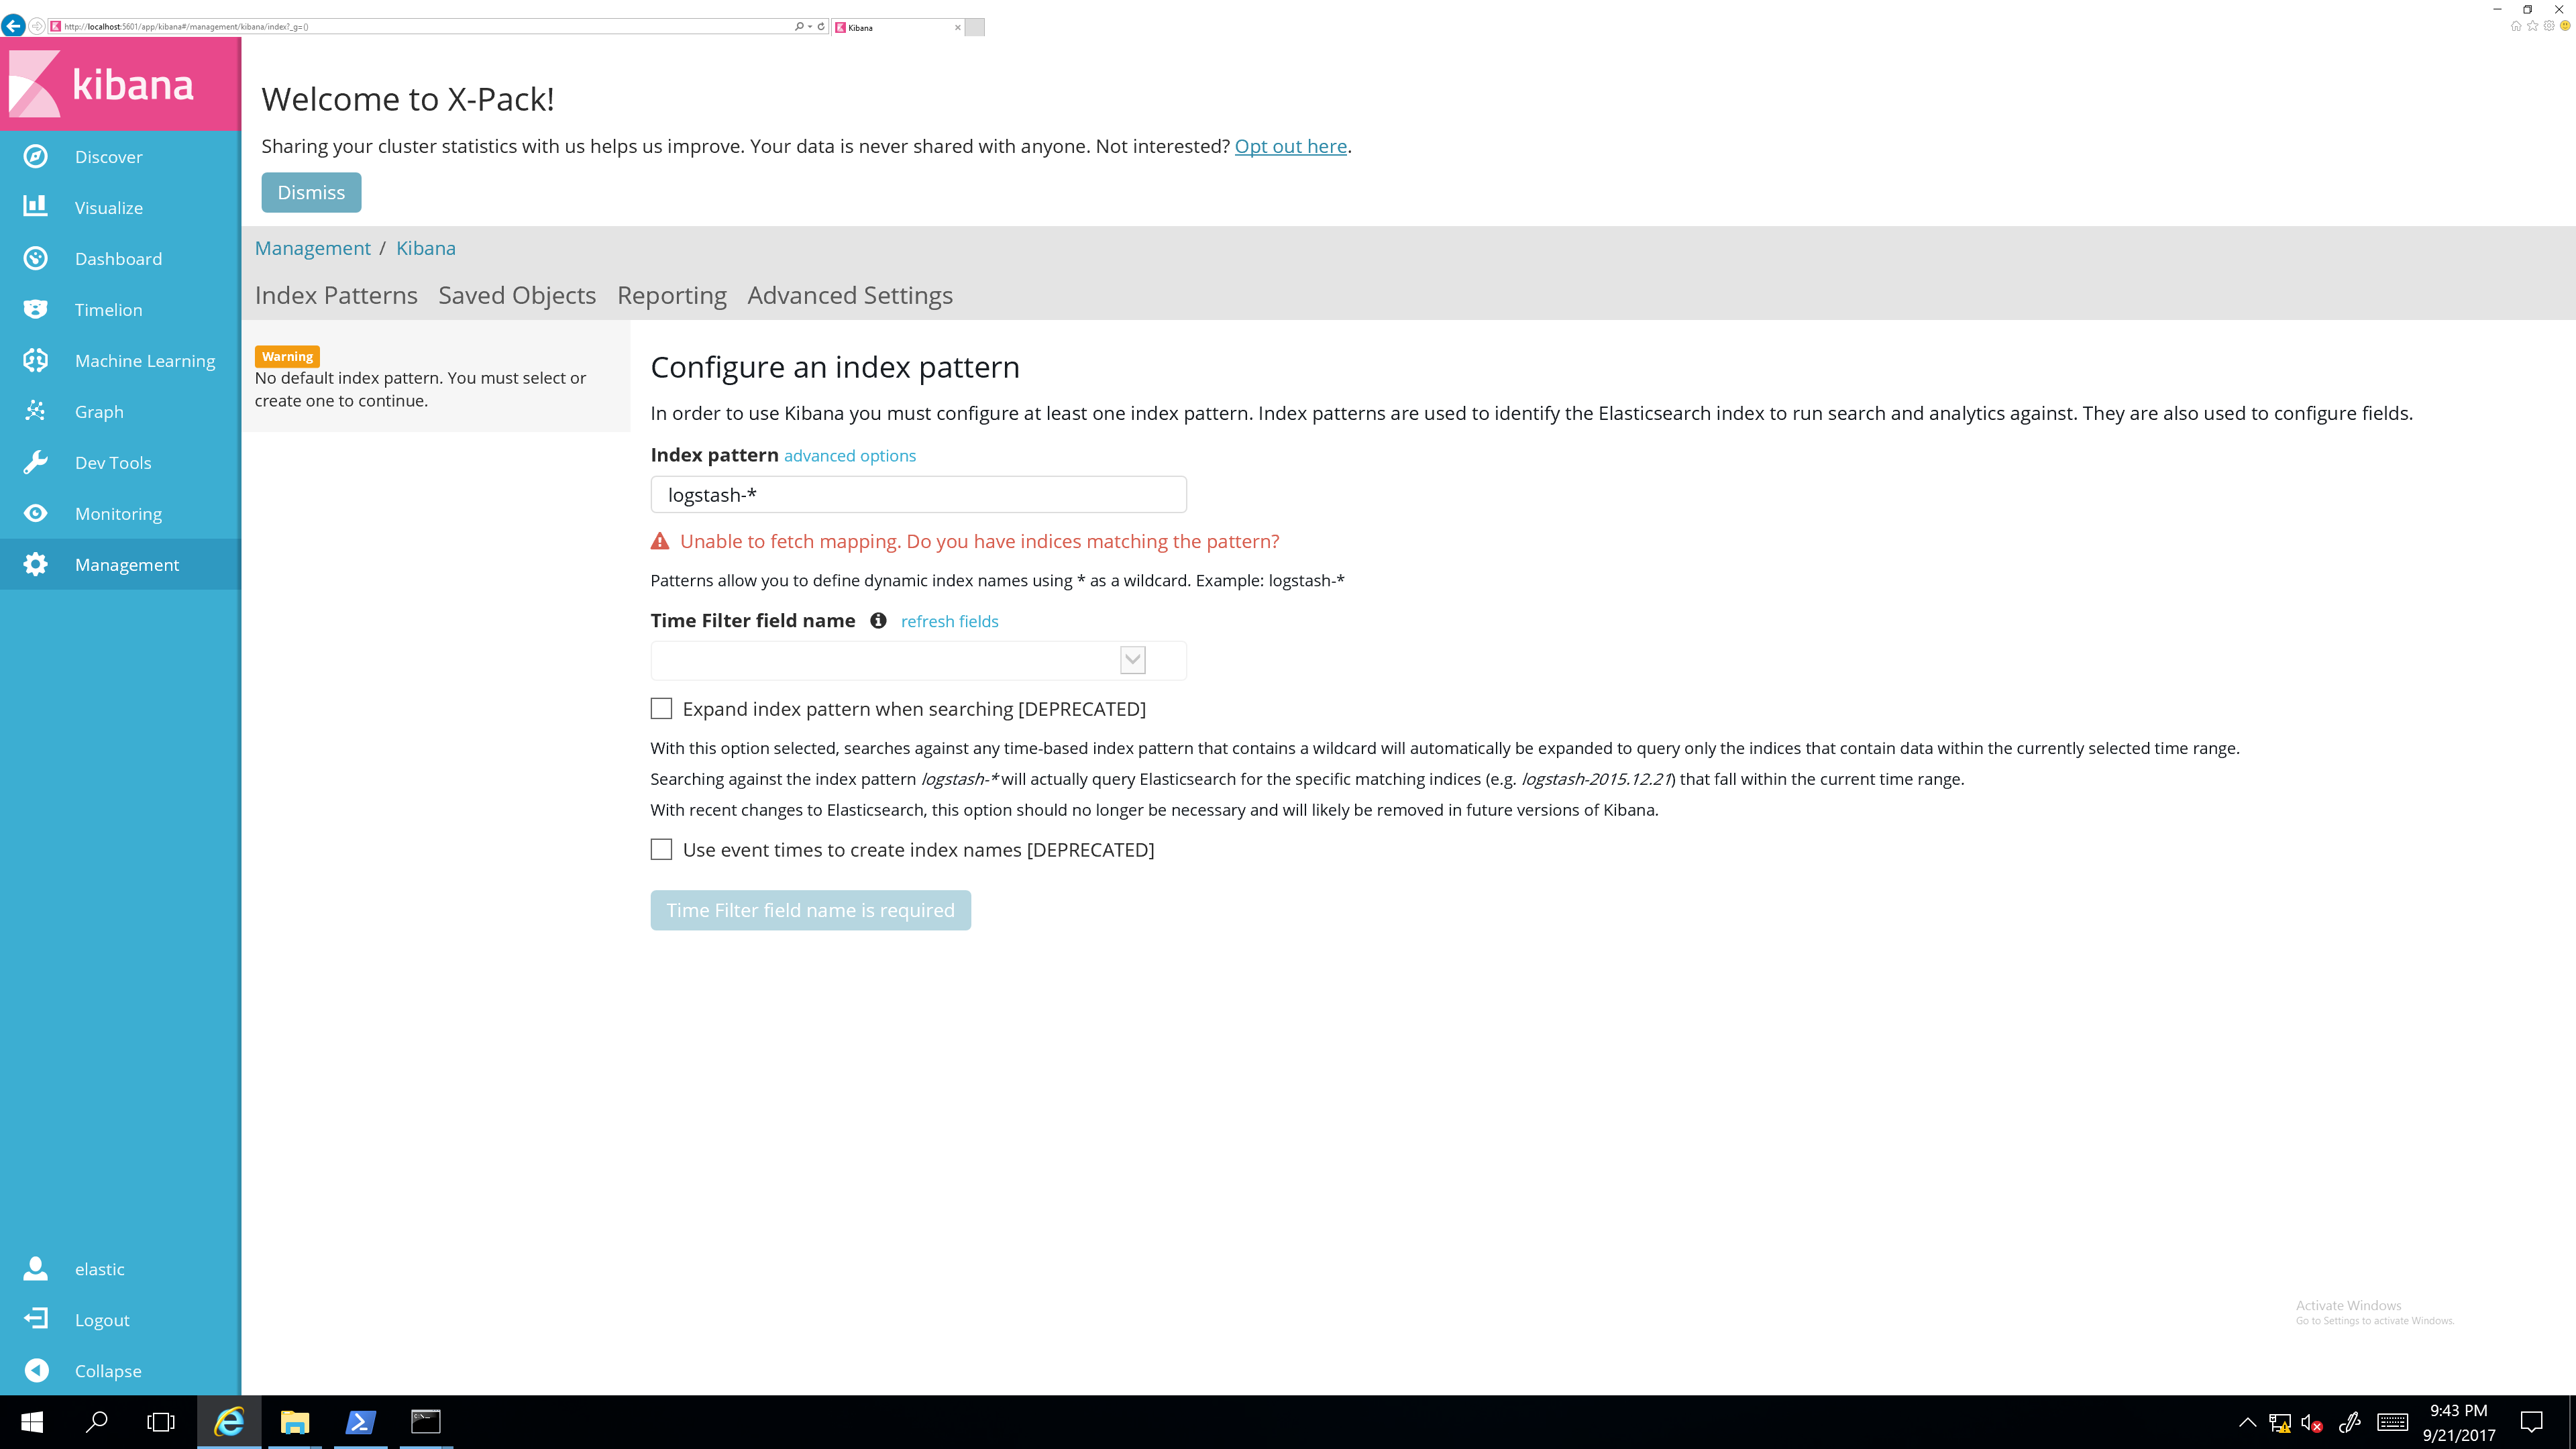
After finishing the installation from scratch, here's the log.
The "License" message doesn't appear anymore. I don't remember the initials "User" and "Password", but I remeber it is posted in the installation guide.
log [04:36:59.579] [info][status][plugin:kibana@5.6.1] Status changed from uninitialized to green - Ready
log [04:36:59.626] [info][status][plugin:elasticsearch@5.6.1] Status changed from uninitialized to yellow - Waiting for Elasticsearch
log [04:36:59.642] [info][status][plugin:xpack_main@5.6.1] Status changed from uninitialized to yellow - Waiting for Elasticsearch
log [04:36:59.861] [info][status][plugin:graph@5.6.1] Status changed from uninitialized to yellow - Waiting for Elasticsearch
log [04:36:59.876] [info][status][plugin:monitoring@5.6.1] Status changed from uninitialized to green - Ready
log [04:37:00.533] [warning][reporting] Generating a random key for xpack.reporting.encryptionKey. To prevent pending reports from failing on restart, please set xpack.reporting.encryptionKey in kibana.yml
log [04:37:00.548] [info][status][plugin:reporting@5.6.1] Status changed from uninitialized to yellow - Waiting for Elasticsearch
log [04:37:00.642] [info][elasticsearch] Adding mappings to kibana index for SavedObject type "graph-workspace"
log [04:37:01.470] [info][status][plugin:elasticsearch@5.6.1] Status changed from yellow to green - Kibana index ready
log [04:37:01.486] [info][license][xpack] Imported license information from Elasticsearch for [data] cluster: mode: trial | status: active | expiry date: 2017-10-21T21:36:05-07:00
log [04:37:01.501] [info][status][plugin:xpack_main@5.6.1] Status changed from yellow to green - Ready
log [04:37:01.533] [info][status][plugin:graph@5.6.1] Status changed from yellow to green - Ready
log [04:37:01.533] [info][status][plugin:reporting@5.6.1] Status changed from yellow to green - Ready
log [04:37:01.533] [info][status][plugin:monitoring@5.6.1] Status changed from green to yellow - Waiting for Monitoring Health Check
log [04:37:04.642] [error][status][plugin:monitoring@5.6.1] Status changed from yellow to red - Request Timeout after 3000ms
log [04:37:13.454] [info][status][plugin:security@5.6.1] Status changed from uninitialized to green - Ready
log [04:37:13.470] [warning][security] Generating a random key for xpack.security.encryptionKey. To prevent sessions from being invalidated on restart, please set xpack.security.encryptionKey in kibana.yml
log [04:37:13.470] [warning][security] Session cookies will be transmitted over insecure connections. This is not recommended.
log [04:37:13.517] [info][status][plugin:searchprofiler@5.6.1] Status changed from uninitialized to green - Ready
log [04:37:13.548] [info][status][plugin:ml@5.6.1] Status changed from uninitialized to green - Ready
log [04:37:13.564] [info][status][plugin:ml@5.6.1] Status changed from green to yellow - Waiting for Elasticsearch
log [04:37:13.579] [info][status][plugin:ml@5.6.1] Status changed from yellow to green - Ready
log [04:37:13.595] [info][status][plugin:tilemap@5.6.1] Status changed from uninitialized to green - Ready
log [04:37:13.658] [info][status][plugin:watcher@5.6.1] Status changed from uninitialized to green - Ready
log [04:37:13.704] [info][status][plugin:monitoring@5.6.1] Status changed from red to green - Ready
log [04:37:13.704] [info][status][plugin:grokdebugger@5.6.1] Status changed from uninitialized to green - Ready
log [04:37:13.704] [info][status][plugin:upgrade@5.6.1] Status changed from uninitialized to green - Ready
log [04:37:13.720] [info][status][plugin:console@5.6.1] Status changed from uninitialized to green - Ready
log [04:37:13.751] [info][status][plugin:metrics@5.6.1] Status changed from uninitialized to green - Ready
log [04:37:13.923] [info][status][plugin:timelion@5.6.1] Status changed from uninitialized to green - Ready
log [04:37:13.939] [info][listening] Server running at http://localhost:5601
log [04:37:13.939] [info][status][ui settings] Status changed from uninitialized to green - Ready
log [04:37:31.508] [info][license][xpack] Imported license information from Elasticsearch for [monitoring] cluster: mode: trial | status: active | expiry date: 2017-10-21T21:36:05-07:100:

The default user name and password should give you access:
User name: elastic
Password: changeme
Glad it worked 
On a fresh install of 5.6.0 - everything should work fine unless otherwise if you try to use upgrade assistant under management. This isn't visible till you install x-pack. So, not really sure what happened with your 5.6.0 installation. I will ask people with windows to take a look at it tomorrow.
Anyways, Thank you very much! Let me know if you have any other questions
Thank you for the guidance!
Now I need to start learning how to work with it 
Just an FYI - 5.6.1-1 upgrade + manual upgrade of xpack plugins on RHEL7 did work for me.
...Before starting a new thread
Great. Thanks for keeping us posted. You didn't touch the upgrade assistant under management under x-pack while you were on 5.6.0 correct?
Nope. All I did was the usual manual upgrade after updating the cluster with yum package manager which entails the following commands:
/usr/share/kibana/bin/kibana-plugin remove x-pack
/usr/share/kibana/bin/kibana-plugin install x-pack
/usr/share/elasticsearch/bin/elasticsearch-plugin remove x-pack
/usr/share/elasticsearch/bin/elasticsearch-plugin install x-pack
Ensured the rest of the cluster hosts without kibana that run elasticsearch had x-pack plugin updated as well, restarted services and my Kibana Dashboard just came back up.
Ok. Great. Thanks!
Hey I ran into the same problem. Interestingly, It happens only when I change user kibana's password other than changeme. When changed back to changeme, it works again. Elastic user does not seem to have the problem. Any idea?
The commands used are:
curl -XPUT -u elastic 'xx.xx.xx.xx.:9200/_xpack/security/user/elastic/_password' -H "Content-Type: application/json" -d '{
"password" : "aarprfpp0c" }'
curl -XPUT -u elastic 'xx.xx.xx.xx:9200/_xpack/security/user/kibana/_password' -H "Content-Type: application/json" -d '{
"password" : "aarprfpp0c" }'
Thanks very much for this suggestion.
I changed passwords as described here Getting Started with Security | X-Pack for the Elastic Stack [5.6] | Elastic
I then got the message, "Please check that Elasticsearch has the X-Pack plugin installed and is reachable, then refresh this page." when I tried to access Kibana. When I changed the kibana password back to changeme as you suggest I was then able to access kibana.
I am using Linux 3.10.0-514.26.2.el7.x86_64 x86_64
You may want to try https://github.com/elastic/stack-docker