Good Morning,
I have a fleet server with 2 hosts :

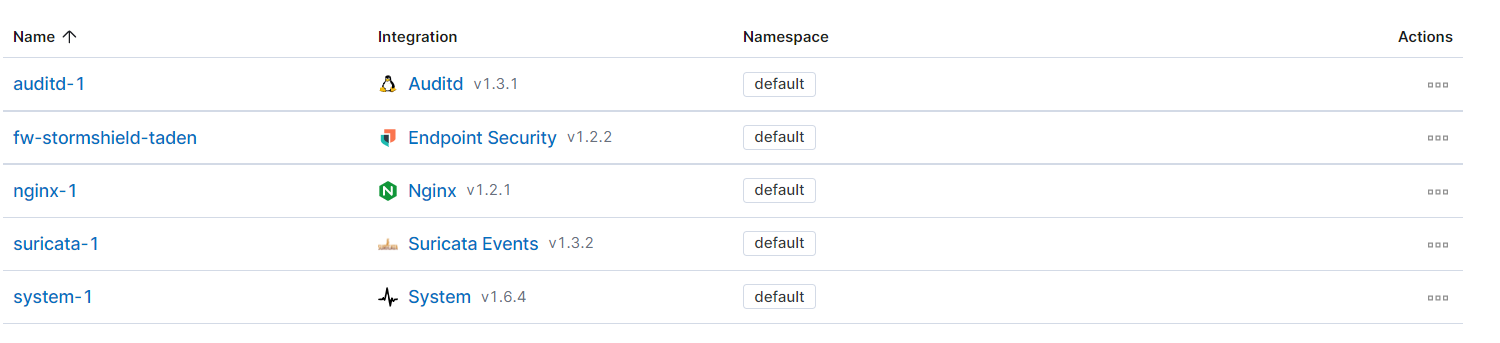
The "kali" host has the following integrations installed with the elastic agent :
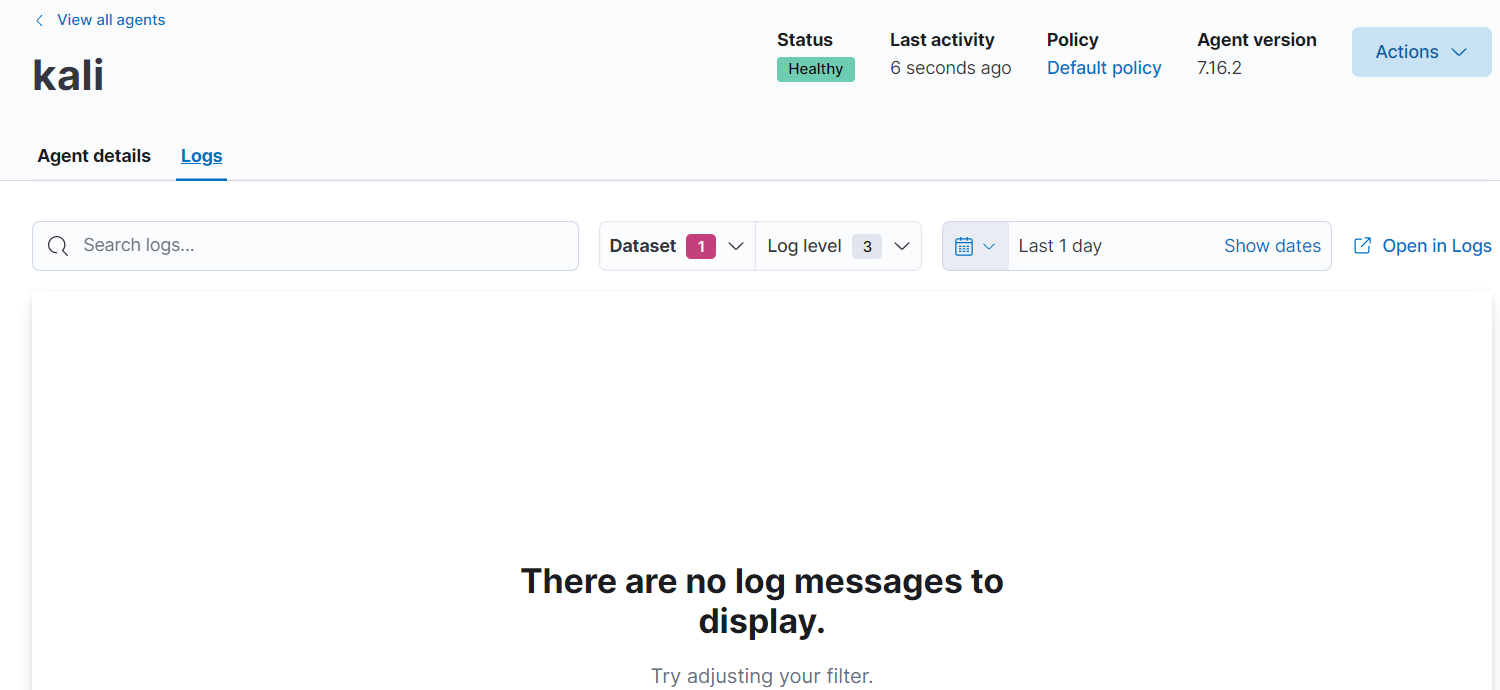
I followed the installation steps from the elastic official webpage and the elastic-agent logs are shown in the fleet tab :

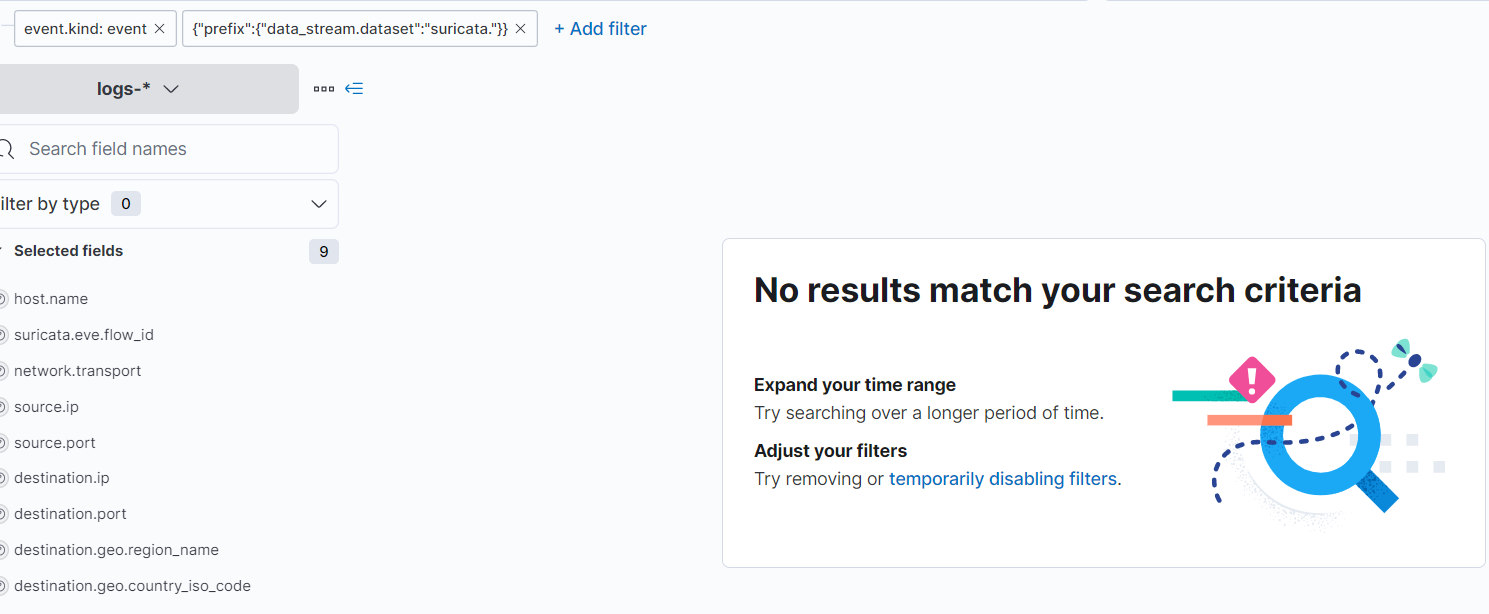
but not in the agent tab of Fleet or the Observability tab of Kibana :
However, the Suricata logs are nowhere to be seen.
In Elastic Security, the endpoint tab shows that logs are indeed retrieved :

Suricata and elastic-agent services are up and running on my kali host.
I also has the right configuration path for my eve.json :

Which is also receiving logs constantly :
{"timestamp":"2022-01-28T05:33:13.536959-0500","flow_id":1035872131166591,"in_iface":"eth0","event_type":"dns","src_ip":"10.0.2.15","src_port":54219,"dest_ip":"10.22.2.1","dest_port":53,"proto":"UDP","dns":{"type":"query","id":57469,"rrname":"testmyids.ca","rrtype":"A","tx_id":0}}
{"timestamp":"2022-01-28T05:33:13.563920-0500","flow_id":1035872131166591,"in_iface":"eth0","event_type":"dns","src_ip":"10.0.2.15","src_port":54219,"dest_ip":"10.22.2.1","dest_port":53,"proto":"UDP","dns":{"version":2,"type":"answer","id":57469,"flags":"8180","qr":true,"rd":true,"ra":true,"rrname":"testmyids.ca","rrtype":"A","rcode":"NOERROR","answers":[{"rrname":"testmyids.ca","rrtype":"A","ttl":300,"rdata":"104.21.22.216"},{"rrname":"testmyids.ca","rrtype":"A","ttl":300,"rdata":"172.67.207.32"}],"grouped":{"A":["104.21.22.216","172.67.207.32"]}}}
{"timestamp":"2022-01-28T05:33:13.874289-0500","flow_id":856943793642889,"in_iface":"eth0","event_type":"http","src_ip":"10.0.2.15","src_port":42432,"dest_ip":"104.21.22.216","dest_port":80,"proto":"TCP","tx_id":0,"http":{"hostname":"testmyids.ca","url":"/","http_user_agent":"Mozilla/5.0 (X11; Linux x86_64; rv:78.0) Gecko/20100101 Firefox/78.0","http_refer":"https://www.google.com/","http_method":"GET","protocol":"HTTP/1.1","status":304,"length":0}}
{"timestamp":"2022-01-28T05:33:13.946728-0500","flow_id":1139544051785360,"in_iface":"eth0","event_type":"http","src_ip":"10.0.2.15","src_port":42434,"dest_ip":"104.21.22.216","dest_port":80,"proto":"TCP","tx_id":0,"http":{"hostname":"testmyids.ca","url":"/cdn-cgi/apps/head/cAIo4dXDidojCEKqfeUEJQVSn1s.js","http_user_agent":"Mozilla/5.0 (X11; Linux x86_64; rv:78.0) Gecko/20100101 Firefox/78.0","http_refer":"http://testmyids.ca/","http_method":"GET","protocol":"HTTP/1.1","status":304,"length":0}}
{"timestamp":"2022-01-28T05:33:13.962526-0500","flow_id":293469854216158,"in_iface":"eth0","event_type":"dns","src_ip":"10.0.2.15","src_port":46349,"dest_ip":"192.168.0.244","dest_port":53,"proto":"UDP","dns":{"type":"query","id":43293,"rrname":"www.google-analytics.com","rrtype":"A","tx_id":0}}
{"timestamp":"2022-01-28T05:33:14.160592-0500","flow_id":625986199549520,"in_iface":"eth0","event_type":"flow","src_ip":"10.0.2.15","src_port":54376,"dest_ip":"10.22.2.1","dest_port":53,"proto":"UDP","app_proto":"dns","flow":{"pkts_toserver":1,"pkts_toclient":1,"bytes_toserver":97,"bytes_toclient":161,"start":"2022-01-28T05:27:26.259664-0500","end":"2022-01-28T05:27:26.277215-0500","age":0,"state":"established","reason":"timeout","alerted":false}}
{"timestamp":"2022-01-28T05:33:15.965588-0500","event_type":"stats","stats":{"uptime":82757,"capture":{"kernel_packets":29297,"kernel_drops":0,"errors":0},"decoder":{"pkts":29297,"bytes":9923250,"invalid":0,"ipv4":29164,"ipv6":51,"ethernet":29297,"chdlc":0,"raw":0,"null":0,"sll":0,"tcp":28842,"udp":305,"sctp":0,"icmpv4":17,"icmpv6":51,"ppp":0,"pppoe":0,"geneve":0,"gre":0,"vlan":0,"vlan_qinq":0,"vxlan":0,"vntag":0,"ieee8021ah":0,"teredo":0,"ipv4_in_ipv6":0,"ipv6_in_ipv6":0,"mpls":0,"avg_pkt_size":338,"max_pkt_size":1514,"max_mac_addrs_src":0,"max_mac_addrs_dst":0,"erspan":0,"event":{"ipv4":{"pkt_too_small":0,"hlen_too_small":0,"iplen_smaller_than_hlen":0,"trunc_pkt":0,"opt_invalid":0,"opt_invalid_len":0,"opt_malformed":0,"opt_pad_required":0,"opt_eol_required":0,"opt_duplicate":0,"opt_unknown":0,"wrong_ip_version":0,"icmpv6":0,"frag_pkt_too_large":0,"frag_overlap":0,"frag_ignored":0},"icmpv4":{"pkt_too_small":0,"unknown_type":0,"unknown_code":0,"ipv4_trunc_pkt":0,"ipv4_unknown_ver":0},"icmpv6":{"unknown_type":0,"unknown_code":0,"pkt_too_small":0,"ipv6_unknown_version":0,"ipv6_trunc_pkt":0,"mld_message_with_invalid_hl":0,"unassigned_type":0,"experimentation_type":0},"ipv6":{"pkt_too_small":0,"trunc_pkt":0,"trunc_exthdr":0,"exthdr_dupl_fh":0,"exthdr_useless_fh":0,"exthdr_dupl_rh":0,"exthdr_dupl_hh":0,"exthdr_dupl_dh":0,"exthdr_dupl_ah":0,"exthdr_dupl_eh":0,"exthdr_invalid_optlen":0,"wrong_ip_version":0,"exthdr_ah_res_not_null":0,"hopopts_unknown_opt":0,"hopopts_only_padding":0,"dstopts_unknown_opt":0,"dstopts_only_padding":0,"rh_type_0":0,"zero_len_padn":18,"fh_non_zero_reserved_field":0,"data_after_none_header":0,"unknown_next_header":0,"icmpv4":0,"frag_pkt_too_large":0,"frag_overlap":0,"frag_invalid_length":0,"frag_ignored":0,"ipv4_in_ipv6_too_small":0,"ipv4_in_ipv6_wrong_version":0,"ipv6_in_ipv6_too_small":0,"ipv6_in_ipv6_wrong_version":0},"tcp":{"pkt_too_small":0,"hlen_too_small":0,"invalid_optlen":0,"opt_invalid_len":0,"opt_duplicate":0},"udp":{"pkt_too_small":0,"hlen_too_small":0,"hlen_invalid":0},"sll":{"pkt_too_small":0},"ethernet":{"pkt_too_small":0},"ppp":{"pkt_too_small":0,"vju_pkt_too_small":0,"ip4_pkt_too_small":0,"ip6_pkt_too_small":0,"wrong_type":0,"unsup_proto":0},"pppoe":{"pkt_too_small":0,"wrong_code":0,"malformed_tags":0},"gre":{"pkt_too_small":0,"wrong_version":0,"version0_recur":0,"version0_flags":0,"version0_hdr_too_big":0,"version0_malformed_sre_hdr":0,"version1_chksum":0,"version1_route":0,"version1_ssr":0,"version1_recur":0,"version1_flags":0,"version1_no_key":0,"version1_wrong_protocol":0,"version1_malformed_sre_hdr":0,"version1_hdr_too_big":0},"vlan":{"header_too_small":0,"unknown_type":0,"too_many_layers":0},"ieee8021ah":{"header_too_small":0},"vntag":{"header_too_small":0,"unknown_type":0},"ipraw":{"invalid_ip_version":0},"ltnull":{"pkt_too_small":0,"unsupported_type":0},"sctp":{"pkt_too_small":0},"mpls":{"header_too_small":0,"pkt_too_small":0,"bad_label_router_alert":0,"bad_label_implicit_null":0,"bad_label_reserved":0,"unknown_payload_type":0},"vxlan":{"unknown_payload_type":0},"geneve":{"unknown_payload_type":0},"erspan":{"header_too_small":0,"unsupported_version":0,"too_many_vlan_layers":0},"dce":{"pkt_too_small":0},"chdlc":{"pkt_too_small":0}},"too_many_layers":0},"flow":{"memcap":0,"tcp":1314,"udp":113,"icmpv4":0,"icmpv6":32,"tcp_reuse":0,"get_used":0,"get_used_eval":0,"get_used_eval_reject":0,"get_used_eval_busy":0,"get_used_failed":0,"wrk":{"spare_sync_avg":100,"spare_sync":4,"spare_sync_incomplete":0,"spare_sync_empty":0,"flows_evicted_needs_work":1207,"flows_evicted_pkt_inject":2282,"flows_evicted":5,"flows_injected":1207},"mgr":{"full_hash_pass":106,"closed_pruned":0,"new_pruned":0,"est_pruned":0,"bypassed_pruned":0,"rows_maxlen":1,"flows_checked":1952,"flows_notimeout":536,"flows_timeout":1416,"flows_timeout_inuse":0,"flows_evicted":1416,"flows_evicted_needs_work":1207},"spare":9809,"emerg_mode_entered":0,"emerg_mode_over":0,"memuse":7474304},"defrag":{"ipv4":{"fragments":0,"reassembled":0,"timeouts":0},"ipv6":{"fragments":0,"reassembled":0,"timeouts":0},"max_frag_hits":0},"flow_bypassed":{"local_pkts":0,"local_bytes":0,"local_capture_pkts":0,"local_capture_bytes":0,"closed":0,"pkts":0,"bytes":0},"tcp":{"sessions":1311,"ssn_memcap_drop":0,"pseudo":0,"pseudo_failed":0,"invalid_checksum":0,"no_flow":0,"syn":1378,"synack":1257,"rst":57,"midstream_pickups":0,"pkt_on_wrong_thread":0,"segment_memcap_drop":0,"stream_depth_reached":0,"reassembly_gap":0,"overlap":0,"overlap_diff_data":0,"insert_data_normal_fail":0,"insert_data_overlap_fail":0,"insert_list_fail":0,"memuse":1212416,"reassembly_memuse":864256},"detect":{"engines":[{"id":0,"last_reload":"2022-01-27T06:34:25.127837-0500","rules_loaded":24522,"rules_failed":0}],"alert":81},"app_layer":{"flow":{"http":12,"ftp":0,"smtp":0,"tls":159,"ssh":0,"imap":0,"smb":0,"dcerpc_tcp":0,"dns_tcp":0,"nfs_tcp":0,"ntp":0,"ftp-data":0,"tftp":0,"ikev2":0,"krb5_tcp":0,"dhcp":8,"snmp":0,"sip":0,"rfb":0,"mqtt":0,"rdp":0,"failed_tcp":0,"dcerpc_udp":0,"dns_udp":105,"nfs_udp":0,"krb5_udp":0,"failed_udp":0},"tx":{"http":1103,"ftp":0,"smtp":0,"tls":0,"ssh":0,"imap":0,"smb":0,"dcerpc_tcp":0,"dns_tcp":0,"nfs_tcp":0,"ntp":0,"ftp-data":0,"tftp":0,"ikev2":0,"krb5_tcp":0,"dhcp":10,"snmp":0,"sip":0,"rfb":0,"mqtt":0,"rdp":0,"dcerpc_udp":0,"dns_udp":295,"nfs_udp":0,"krb5_udp":0},"expectations":0},"http":{"memuse":7049,"memcap":0},"ftp":{"memuse":0,"memcap":0},"file_store":{"open_files":0}}}
{"timestamp":"2022-01-28T05:33:16.162813-0500","flow_id":1049603134303558,"in_iface":"eth0","event_type":"flow","src_ip":"10.0.2.15","src_port":54910,"dest_ip":"192.168.0.244","dest_port":53,"proto":"UDP","app_proto":"dns","flow":{"pkts_toserver":2,"pkts_toclient":0,"bytes_toserver":174,"bytes_toclient":0,"start":"2022-01-28T05:31:21.240966-0500","end":"2022-01-28T05:31:21.240998-0500","age":0,"state":"new","reason":"timeout","alerted":false}}
{"timestamp":"2022-01-28T05:33:18.967540-0500","flow_id":2047968289932148,"in_iface":"eth0","event_type":"dns","src_ip":"10.0.2.15","src_port":52323,"dest_ip":"10.22.2.1","dest_port":53,"proto":"UDP","dns":{"type":"query","id":43293,"rrname":"www.google-analytics.com","rrtype":"A","tx_id":0}}
I may need to configure manually something on the elastic-agent configuration file but I didn't find what to change.
Could you help me figure out how to show the Suricata logs with Fleet ?
Thank you for your help