Hi Everyone,
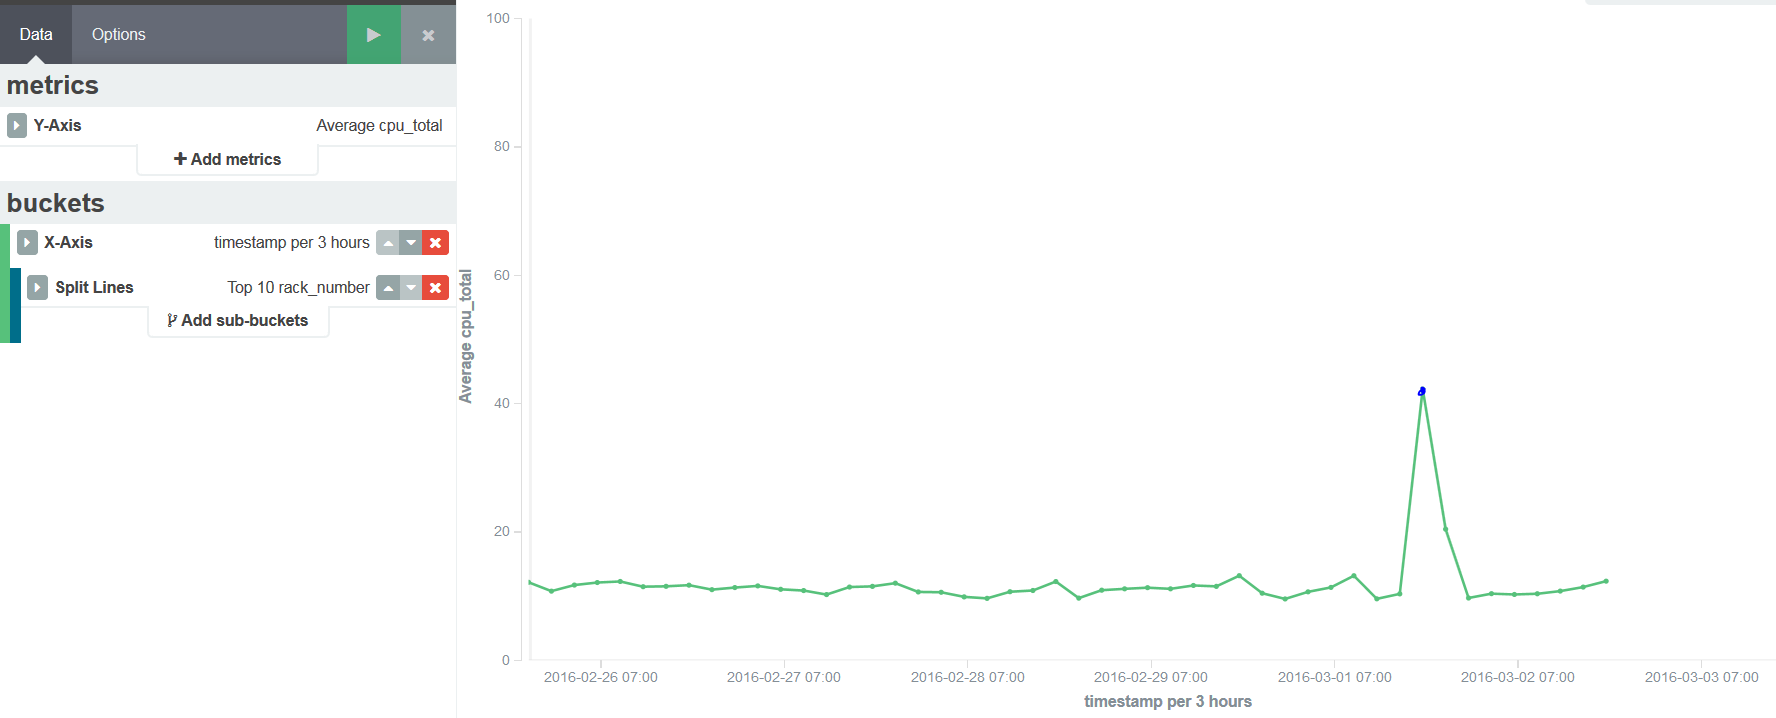
I have the time-series dataset with the following mapping. I am able to visualize this easily using line chart, where x-axis is timestamp and y-axis is avg cpu_total. now I am analyzing these data points using a code (outside of ELK), and marking selected data points as outliers. I plan to add this analysis back into the dataset (as a new field (string / float)) and then would like to visualize in a way that outliers are plotted with a separate color. How do I go about this?
{
"system_data" : {
"mappings" : {
"cpu_all" : {
"properties" : {
"cpu_sys" : {
"type" : "float"
},
"cpu_total" : {
"type" : "float"
},
"cpu_user" : {
"type" : "float"
},
"cpu_wait" : {
"type" : "float"
},
"rack_no" : {
"type" : "string"
},
"timestamp" : {
"type" : "date",
"format" : "dateOptionalTime"
}
}
}
}
}
}