Hi there.
Im using elastic agent to load all my system metrics in the dashboards given by kibana, the problem is that when i use the default metrics recollection time (10 seconds) it works well, giving me a perfect view:
Set your collection interval to 60s and collect 10 min of data and then time picker to Last 1hr <!-- Most important and let me know what you see. It should like below. Then I will explain what is happening and how to fix it.
[Skipping long explanation of collection intervals and TSVB intervals etc ]
In short for TSVB visualization to work (well/best) when the TSVB interval is >= to the Metric Collection interval which you have set to 1m
First / Overall Issue:
You have chosen 1m collection interval which is totally fine.
When you you set the timepicker to 15mins, TSVB auto interval is set to 10s, therefor there is no data in the 2nd to last bucket (because we drop the last) for the gauge to work. When we set it to 1 hour the auto interval pick 60s / 1m
The solution is to set the TSVB interval to >=1m for the visualizations for a metrics collection rate of 1m. Today you will need to go in and fix them. If you do then they should work fine.
You should go in and fix that for all the visualizations, Including the Line / Graph and Top N.
With respect to the Top Processes (All Top N) set to interval to >=1m pretty sure there may still be an issue with that. Report Back
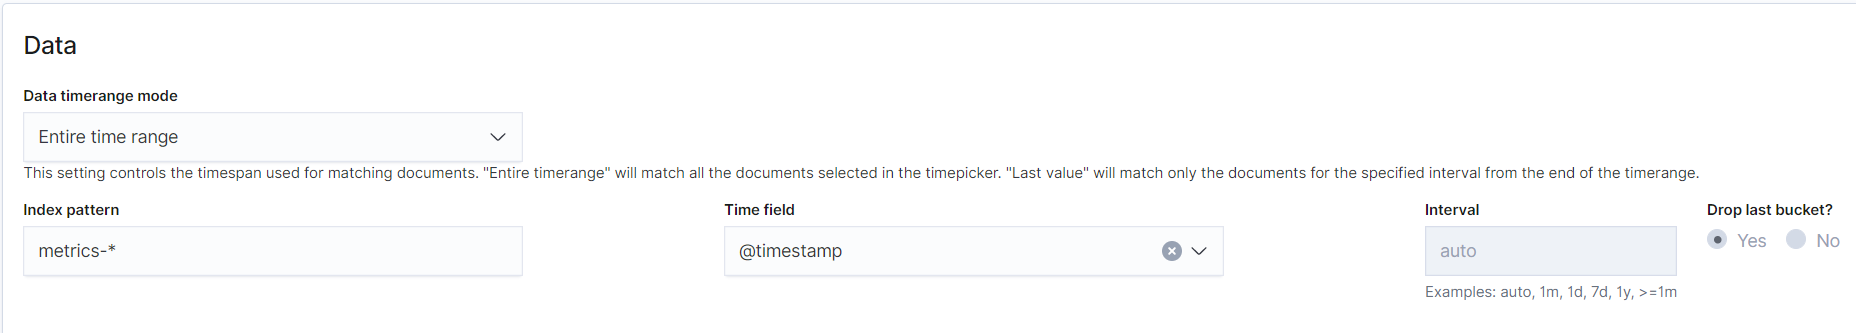
With respect to Disk Used. The Data Time Range more is set to Entire time range so that means that value represents the Average of the Entire time range of the Time Picker. 15min or 1 Hour etc. Because it is over the entire time range the interval is no longer relevant.
You can leave is this way if you want, Me I like to know the disk used recently so I set that back to Last value and set the interval to >=1m
Indeed disk is working well making those changes, about Top N i realized i set that one previusly on 5 minutes, so i change it back to 1 minute like the others to see if it is working and its looking like this
First when you try to squeeze down time when you have a low collection rate, the results are not going to be great... If you have 5 mins Timepicker and collect at 1 min and then throw out the last bucket you at max will have 4 data point (rare) at generally 3 ... Should still work but keep that in mind.
Yeah I think there is a bug with the Table I will look into it when I get a chance.... It works with entire time range but does not seems to be working with Last Value
Apache, Apache Lucene, Apache Hadoop, Hadoop, HDFS and the yellow elephant
logo are trademarks of the
Apache Software Foundation
in the United States and/or other countries.