Hello,
We are using Kibana v8.10.4 and have installed elastic agent on one linux and a windows system.
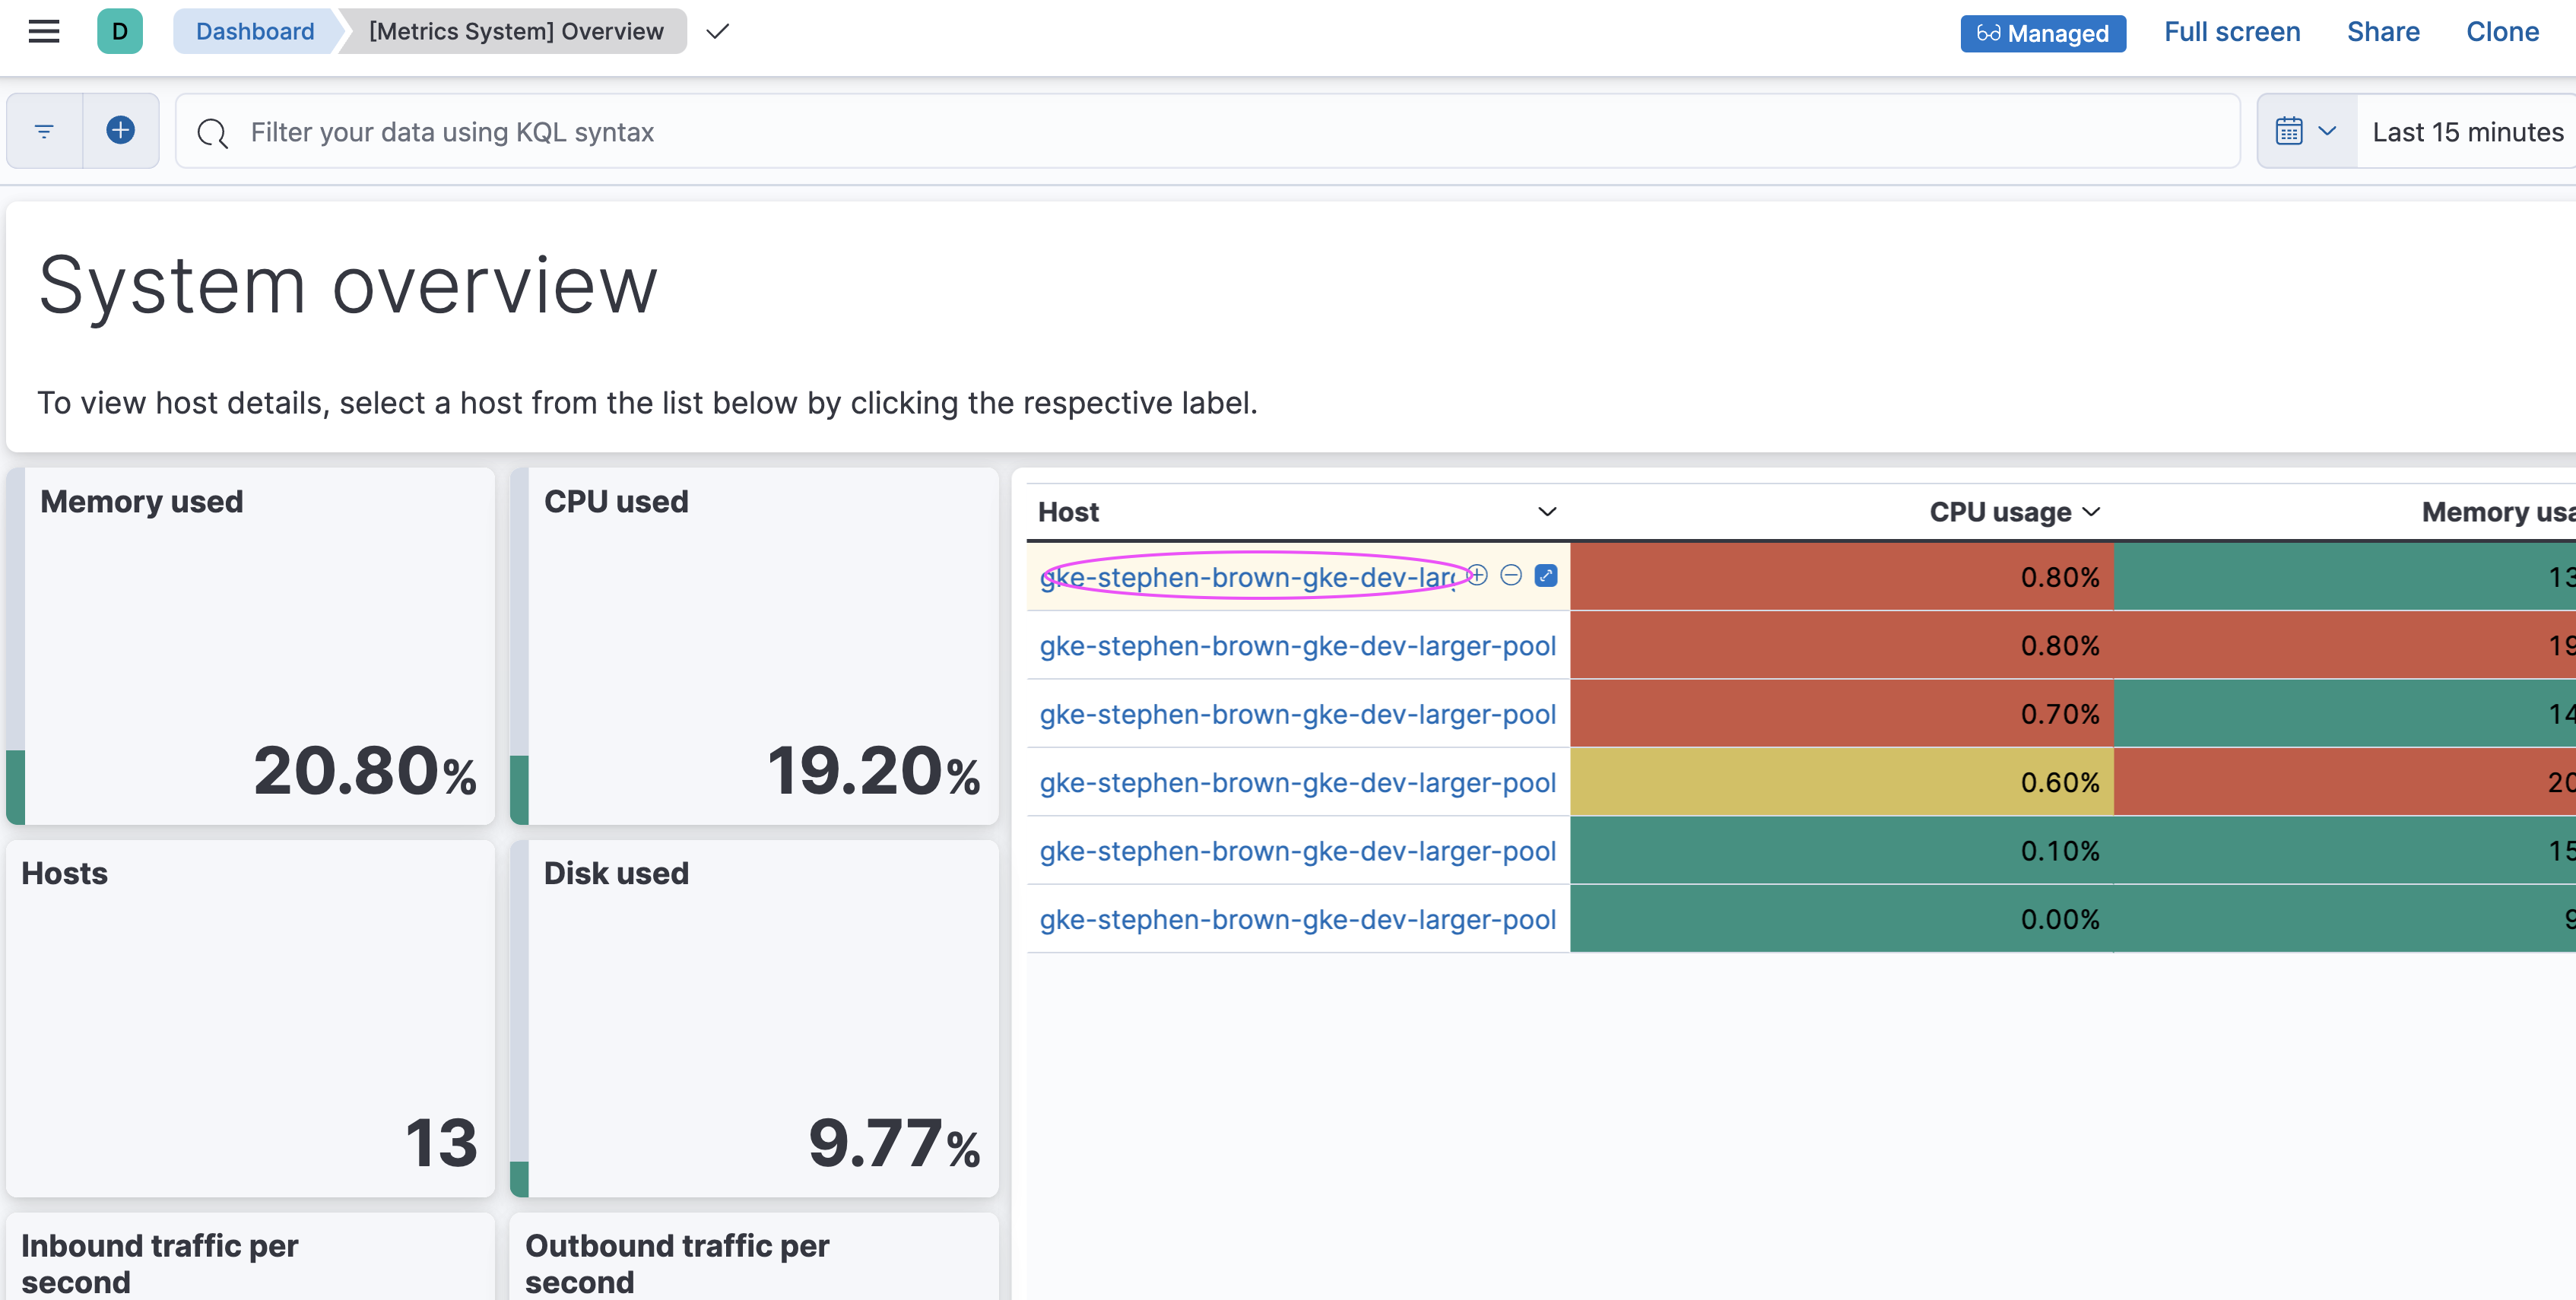
I do see logs/metrics coming in and see the dashboard visualizations getting populated for the Metrics system overview dashboard. But if I click the host name in that dashboard it takes me to different page which results into a 404 dashboard not found page. Please check the attached screenshots
Welcome back! I assume you are usingThat looks like a potential bug to me. Can you raise a GitHub bug request issue for Kibana with the details and the URL resulting in a 404 and we'll take a look.
If you need help raising the issue let me know and provide the URL generating the 404 error.
server.publicBaseUrl
The publicly available URL that end-users access Kibana at. Must include the protocol, hostname, port (if different than the defaults for http and https, 80 and 443 respectively), and the server.basePath (if configured). This setting cannot end in a slash (/).
Yes, I did reload the page, but still the same thing.
I logged with the superuser credentials.
I didn't get what you meant by Also so perhaps you are missing the port?
Got it, I added that URL as I used to get a warning as soon as I logged into Kibana.
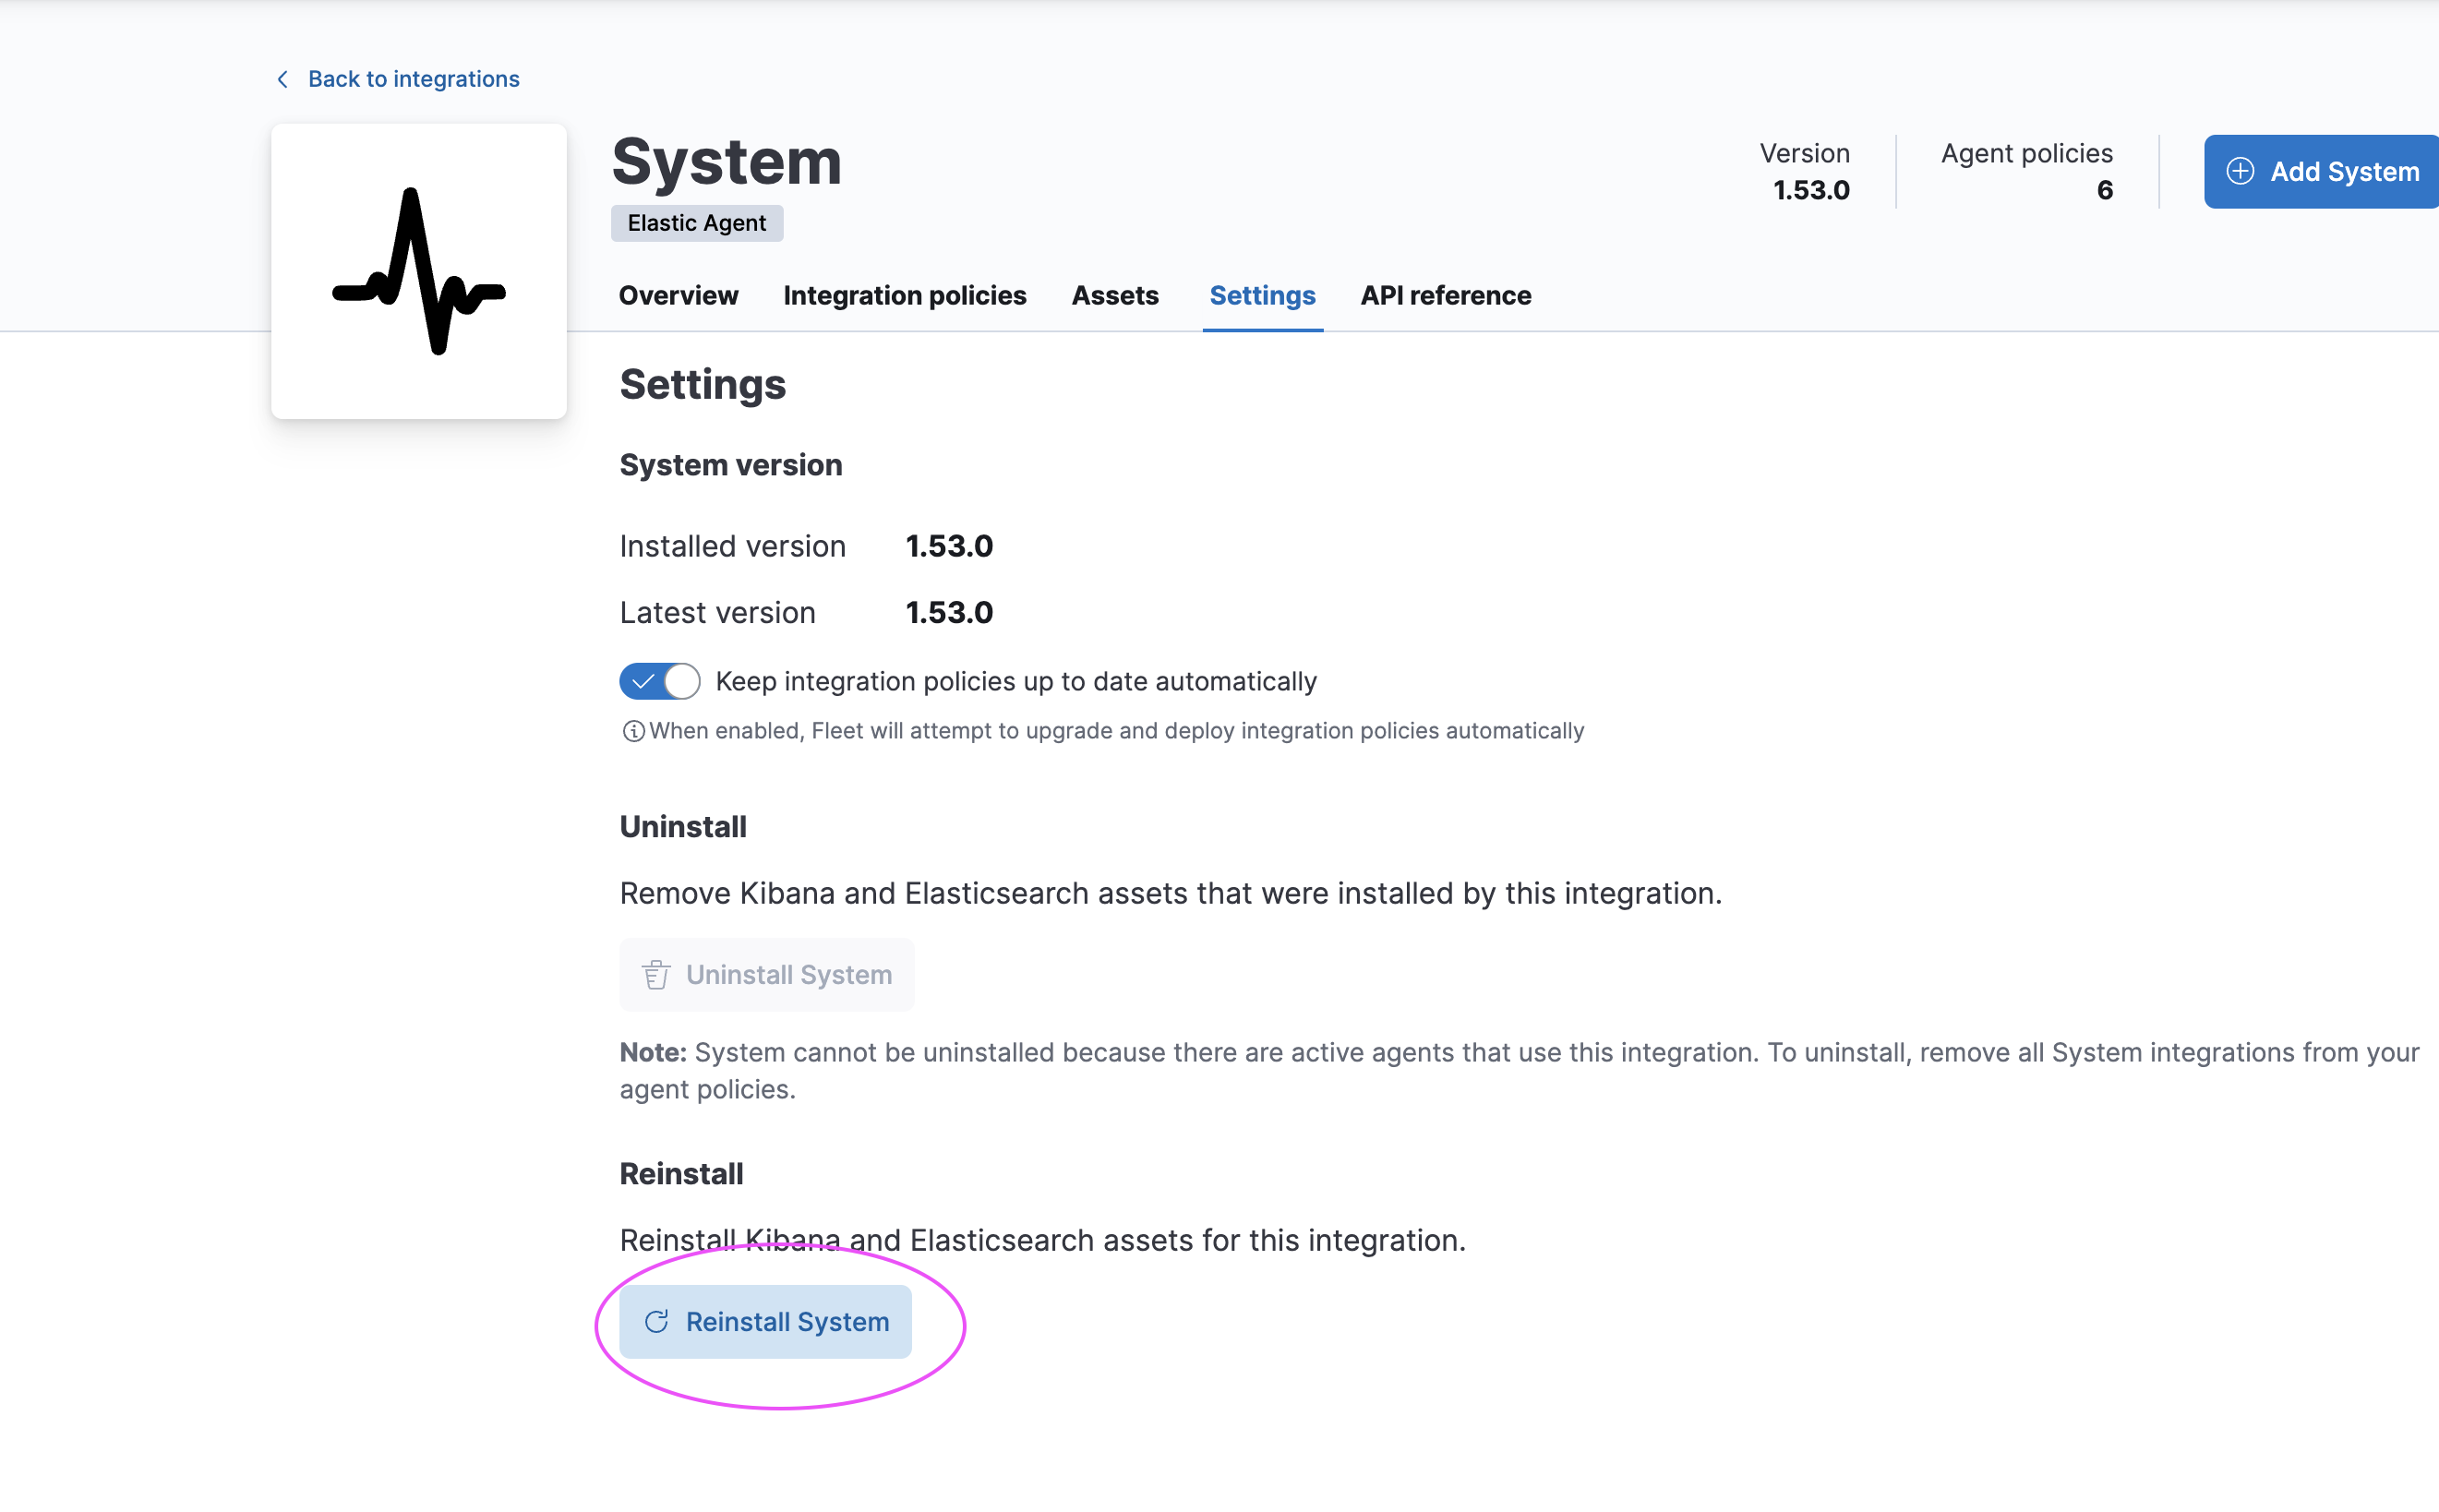
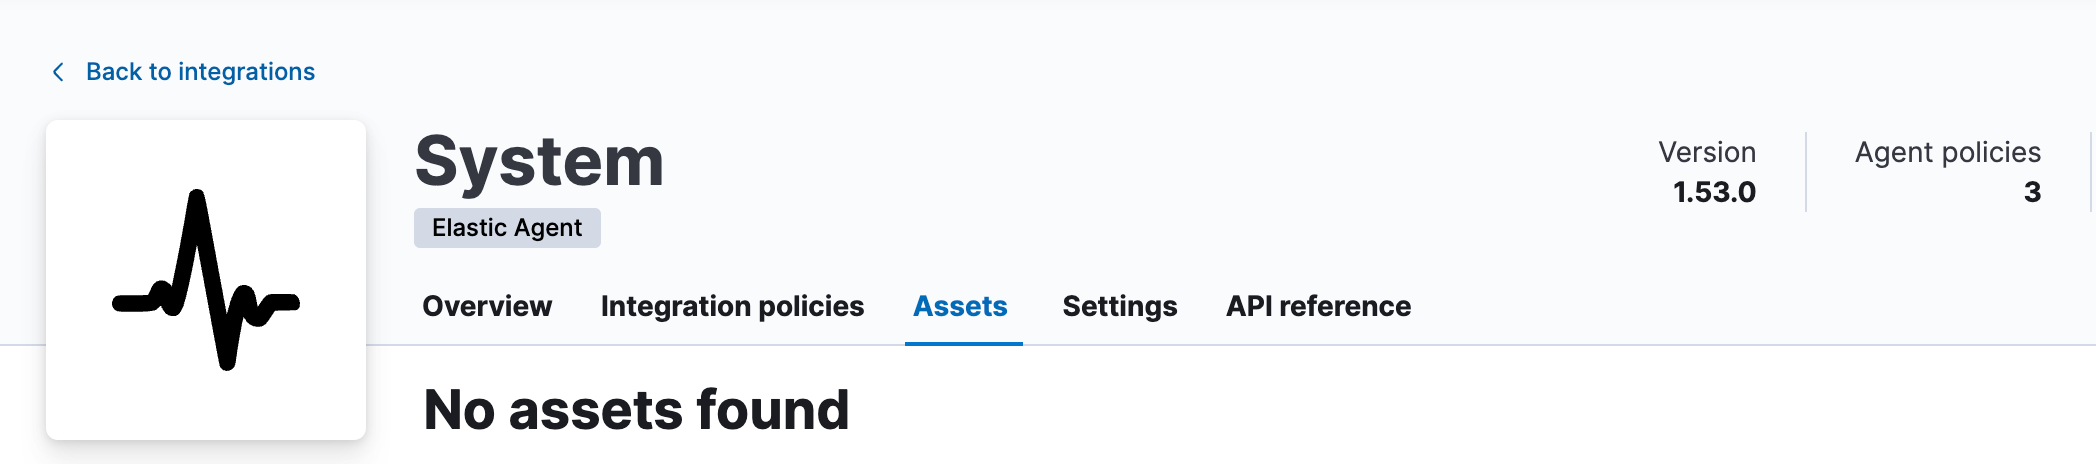
Also I checked my dev kibana instance and I do see the assets under system integration.
Apache, Apache Lucene, Apache Hadoop, Hadoop, HDFS and the yellow elephant
logo are trademarks of the
Apache Software Foundation
in the United States and/or other countries.