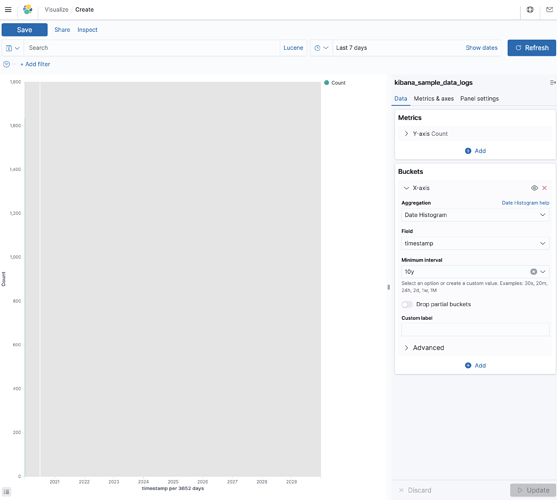
Minimum interval on "Date Histogram" aggregation

Hi folks,

I'm using ELK stack (v7.8.0, same on v7.7.1) for an application used by historians, where each entry is an archive which can be like from year 1687 for example.

Rendering options of Kibana are generally very much oriented on main use case (typically logs monitoring) where contents dates are quite recent, and this is sometimes not making life easy for older entries.

One example, for "Date Histogram", for the "minimum interval", well:
1- first of all "auto" doesn't work ("invalid interval format") and I cannot set a custom interval, say every 50 years : "50y doesn't match any option"
2- predefined list works but only goes up to "Yearly" which is far too small in my use case. Adding decade, century and millenium would be cool
3- using "Lens" allows me to set 3000days interval, but not several years
Any solution for topic 1) and 3) ? any adaptation maybe in future version for topic 2) ?

Thanks!

1 Like

Hi @laurentml

This a very interesting use case, I do agree that Kibana is optimized for recent dates. Maybe let's start bottom up to analyze this. Could you share an example of your data? A single record in JSON format should be sufficient , information about the mapping you're using would of course also be helpful.

Thx and best,
Matthias

Hi Matthias,

Thanks a lot for your enthousiastic feedback.
First some explanations and then the sample data. I guess this explanation will be quite far from what you strictly need to analyze the problem, but maybe some background details on the usecase can help in some way ...

Historians often work with "archives" usually kept allong centuries in libraries, national or local archive centers or for example in churches which at that time had the role of the state for many things.
Those archives are simply old peaces of papers hard to read btw :slight_smile:

What historians would do is to "transcript" the contents of say several thousands of such archives relevant to their topic, and assign to each of them also some metadata (name of institution which produced or stores it, date of production, names of characters involved and/or referenced, or any other information interesting for the field of study (say amount and color of hats and shoes listed in an inventory).

From such data, often CSV or Excel file, produced by the historian, consistency and reconciliation work is usually needed, typically with a tool called "OpenRefine" (A regex-oriented Excel-like app to clean the data basically).

Then the (opensource) application I develop (metaindex.fr) intends to help historians (which are rarelly IT scientists) to define a catalog of their archives, customize it with proper fields and typing, populate, share, explore and present contents (and pictures, links etc.).

At last, Kibana is used as is then for the statistical part of the work.

This statistical work will very much change depending on the field of each historian and the type of the archives it work on, but basically it consists in correlating periods (for example histograms with 10-years-wide bars from year 1550 to 1710, or 3 pies charts showing evolution of avg amount of shoes in inventories depending on the social status of the owner, within 3 periods [1550,1600[, [1600,1650[ and [1650,1700[.

Well, that's it.
Following sample is extracted from validation data (so generated with a script). It contains french ids, sorry, but I tried to annotate it with some contextualisation.

Hope all of this can help. Feel free to ask for more details if needed, i'll be happy to provide more info or data!

Laurent

Sample Record
{
"_index" : "demo_archives",
"_type" : "_doc",
"_id" : "archive_0300",
"_score" : 1.0,
"_source" : {

       // the date of production of the archive, used as Kibana timefield 
      "date" : "14/09/1534", 

      // where is stored the archive (an old church in this case)
      "lieux_conservation" : "Abbaye de Fontenay",

      // some local ID within the storage institution
      "cote" : "ZTG 42//341",

       // typology of archive (here somebody paying something to somebody else)  
      "type_acte" : "rente", 

       // ref to a picture of the document
      "pic" : "document_0001.jpg", 

      // the type of institution who produced the archive at that time (here some kind of judge)
      "type_producteur" : "judiciaire", 

      // coma-separated list of ids of some other documents in same index (i.e. links between archives referencing each other). This is interpreted by applicative layer but would be great to have support for interpreting such field in Kibana (the ELK 'relation' is quite restrictive for my use case). Dream would be abality to query over the properties of linked documents; single level of indirection would be already 98% of the need. Maybe i'll try to make a Kibana plugin to play with that one day.
      "liens" : "archive_4262,archive_6380", 

      // id of user having performed last update  (for applicative layer)
      "mx_updated_userid" : 1344,

      // date of latest modif of the document (for applicative layer)
      "mx_updated_timestamp" : "2020-06-29 22:31:53.089"
    }

The mapping
{
"demo_archives" : {
"aliases" : { },
"mappings" : {
"properties" : {
"cote" : {
"type" : "text",
"fields" : {
"keyword" : {
"type" : "keyword"
}
},
"fielddata" : true
},
"date" : {
"type" : "date",
"ignore_malformed" : true,
"null_value" : "0000",
"format" : "yyyy||MM/yy||MM-yy||MM/yyyy||MM-yyyy||yyyy/MM/dd||yyyy/MM||yyyy/MM/dd HH:mm||yyyy/MM/dd HH:mm:ss||yyyy/MM/dd HH:mm:ss.SSS||yyyy-MM-dd||yyyy-MM||yyyy-MM-dd HH:mm||yyyy-MM-dd HH:mm:ss||yyyy-MM-dd HH:mm:ss.SSS||dd-MM-yy||dd-MM-yyyy||dd-MM-yyyy HH:mm||dd-MM-yyyy HH:mm:ss||dd-MM-yyyy HH:mm:ss.SSS||dd/MM/yy||dd/MM/yyyy||dd/MM/yyyy HH:mm||dd/MM/yyyy HH:mm:ss||dd/MM/yyyy HH:mm:ss.SSS"
},
"liens" : {
"type" : "text",
"fields" : {
"keyword" : {
"type" : "keyword"
}
},
"fielddata" : true
},
"lieux_conservation" : {
"type" : "text",
"fields" : {
"keyword" : {
"type" : "keyword"
}
},
"fielddata" : true
},
"mx_updated_timestamp" : {
"type" : "date",
"ignore_malformed" : true,
"null_value" : "0000",
"format" : "yyyy||MM/yy||MM-yy||MM/yyyy||MM-yyyy||yyyy/MM/dd||yyyy/MM||yyyy/MM/dd HH:mm||yyyy/MM/dd HH:mm:ss||yyyy/MM/dd HH:mm:ss.SSS||yyyy-MM-dd||yyyy-MM||yyyy-MM-dd HH:mm||yyyy-MM-dd HH:mm:ss||yyyy-MM-dd HH:mm:ss.SSS||dd-MM-yy||dd-MM-yyyy||dd-MM-yyyy HH:mm||dd-MM-yyyy HH:mm:ss||dd-MM-yyyy HH:mm:ss.SSS||dd/MM/yy||dd/MM/yyyy||dd/MM/yyyy HH:mm||dd/MM/yyyy HH:mm:ss||dd/MM/yyyy HH:mm:ss.SSS"
},
"mx_updated_userid" : {
"type" : "short"
},
"pic" : {
"type" : "text",
"fields" : {
"keyword" : {
"type" : "keyword"
}
},
"fielddata" : true
},
"type_acte" : {
"type" : "text",
"fields" : {
"keyword" : {
"type" : "keyword"
}
},
"fielddata" : true
},
"type_producteur" : {
"type" : "text",
"fields" : {
"keyword" : {
"type" : "keyword"
}
},
"fielddata" : true
}
}
},
"settings" : {
"index" : {
"creation_date" : "1593469870363",
"number_of_shards" : "1",
"number_of_replicas" : "1",
"uuid" : "oNL5TFIiTU2S2TZJcSOtsw",
"version" : {
"created" : "7080099"
},
"provided_name" : "demo_archives"
}
}
}
}

Thanks a lot for this interesting context, due to a short week, I can't take care of it immediately, but I've bookmarked it, not to forget.

Best,
Matthias

  1. Please format the mapping as code. That helps a lot in terms of readability.
  2. Not really helping your problem but you could apply for the elastic search award. Your project sounds very interesting.
  3. What will be displayed on your graphs? I think vega allows for larger timescales. https://vega.github.io/vega-lite/docs/timeunit.html .

EDIT
Tested it with some data:

Vega script:

{
  "$schema": "https://vega.github.io/schema/vega/v4.3.json",
  "description": "A basic line chart example.",
  "padding": 5,
  
data: [
{
  name:"table"
    url: {
      %context%: true
      %timefield%: @timestamp
      index: archives
      body: {
        "size": 1000,
        "_source": ["@timestamp", "value"],
        "sort" : { "@timestamp" : "desc" }
      },
    }
    format: { property: "hits.hits" },
    transform: [
        { type: "formula",as: "time", expr: "datetime(datum._source['@timestamp'])"}
      ]
  }
],
  "scales": [
    {
      "name": "timex",
      "type": "time",
      "range": "width",
      "domain": {"data": "table", "field": "time"}
    },
    {
      "name": "NameArchives",
      "type": "linear",
      "range": "height",
      "nice": true,
      "zero": true,
      "domain": {"data": "table", "field": "_source.value"}
    }
  ],
  "axes": [
    {
    "orient": "bottom", 
    "scale": "timex", 
    "format": "%Y",
    "grid":"true"
    },
    {
    "orient": "left", 
    "scale": "NameArchives",
    "grid":"true"}
  ],
  "marks": [
  {
      "type": "line",
      "from": {"data": "table"},
      "encode": {
        "enter": {
          "x": {"scale": "timex", "field": "time"},
          "y": {"scale": "NameArchives", "field": "_source.value"}
          "stroke": {"value": "#FF00FF"},
          "strokeWidth": "1"
        }
      }
    }
  ]
}

What my example data looks like:

"hits": [
            {
                "_index": "archives",
                "_type": "doc",
                "_id": "1",
                "_score": 1.0,
                "_source": {
                    "@timestamp": "1518-02-27T22:26:39Z",
                    "value": "2"
                }
            },
            {
                "_index": "archives",
                "_type": "doc",
                "_id": "2",
                "_score": 1.0,
                "_source": {
                    "@timestamp": "1793-02-27T22:26:39Z",
                    "value": "4"
                }
            },
            {
                "_index": "archives",
                "_type": "doc",
                "_id": "3",
                "_score": 1.0,
                "_source": {
                    "@timestamp": "1550-02-27T22:26:39Z",
                    "value": "2"
                }
            },
            {
                "_index": "archives",
                "_type": "doc",
                "_id": "4",
                "_score": 1.0,
                "_source": {
                    "@timestamp": "1693-02-27T22:26:39Z",
                    "value": "1"
                }
            }
        ]

Hope this helps in some way.

Cheers,
defalt

Formated Mapping

{
"demo_archives" : {
  "aliases" : { },
  "mappings" : {
  "properties" : {
  "cote" : {
    "type" : "text",
    "fields" : {
    "keyword" : {
        "type" : "keyword"
        }
    },
    "fielddata" : true
},
"date" : {
    "type" : "date",
    "ignore_malformed" : true,
    "null_value" : "0000",
    "format" : "yyyy||MM/yy||MM-yy||MM/yyyy||MM-yyyy||yyyy/MM/dd||yyyy/MM||yyyy/MM/dd HH:mm||yyyy/MM/dd HH:mm:ss||yyyy/MM/dd HH:mm:ss.SSS||yyyy-MM-dd||yyyy-MM||yyyy-MM-dd HH:mm||yyyy-MM-dd HH:mm:ss||yyyy-MM-dd HH:mm:ss.SSS||dd-MM-yy||dd-MM-yyyy||dd-MM-yyyy HH:mm||dd-MM-yyyy HH:mm:ss||dd-MM-yyyy HH:mm:ss.SSS||dd/MM/yy||dd/MM/yyyy||dd/MM/yyyy HH:mm||dd/MM/yyyy HH:mm:ss||dd/MM/yyyy HH:mm:ss.SSS"
    },
    "liens" : {
    "type" : "text",
    "fields" : {
        "keyword" : {
            "type" : "keyword"
        }
    },
    "fielddata" : true
},
"lieux_conservation" : {
    "type" : "text",
    "fields" : {
        "keyword" : {
            "type" : "keyword"
        }
    },
    "fielddata" : true
},
"mx_updated_timestamp" : {
    "type" : "date",
    "ignore_malformed" : true,
    "null_value" : "0000",
    "format" : "yyyy||MM/yy||MM-yy||MM/yyyy||MM-yyyy||yyyy/MM/dd||yyyy/MM||yyyy/MM/dd HH:mm||yyyy/MM/dd HH:mm:ss||yyyy/MM/dd HH:mm:ss.SSS||yyyy-MM-dd||yyyy-MM||yyyy-MM-dd HH:mm||yyyy-MM-dd HH:mm:ss||yyyy-MM-dd HH:mm:ss.SSS||dd-MM-yy||dd-MM-yyyy||dd-MM-yyyy HH:mm||dd-MM-yyyy HH:mm:ss||dd-MM-yyyy HH:mm:ss.SSS||dd/MM/yy||dd/MM/yyyy||dd/MM/yyyy HH:mm||dd/MM/yyyy HH:mm:ss||dd/MM/yyyy HH:mm:ss.SSS"
},
"mx_updated_userid" : {
    "type" : "short"
},
"pic" : {
    "type" : "text",
    "fields" : {
        "keyword" : {
            "type" : "keyword"
        }
    },
    "fielddata" : true
},
"type_acte" : {
    "type" : "text",
    "fields" : {
        "keyword" : {
            "type" : "keyword"
        }
    },
    "fielddata" : true
},
"type_producteur" : {
    "type" : "text",
    "fields" : {
        "keyword" : {
            "type" : "keyword"
        }
    },
    "fielddata" : true
}
}},
"settings" : {
    "index" : {
        "creation_date" : "1593469870363",
        "number_of_shards" : "1",
        "number_of_replicas" : "1",
        "uuid" : "oNL5TFIiTU2S2TZJcSOtsw",
        "version" : {
            "created" : "7080099"
        },
        "provided_name" : "demo_archives"
    }
}}}

Thanks defalt for your comments.
I've just replied up there with the mapping in proper formatting.

For the ELK awards, good idea, I just filled in the form!

For the VEGA graph, thanks a lot for your working example.
I've considered in the past months using VEGA indeed. The problem is that each searcher will want to create different charts, and letting them writing their own VEGA definition is definitly not an option.
I could also create a "VEGA-code-generator" on application layer, but, well, that would be for a limited amout of specific charts, for the rest, plain Kibana charts shall be the mainstream solution, in my opinion.

I think we really are not far from a solution, probably a matter of tweeking some optimization or default value on few rendering parameters ... hope Kibana team can fix it or give a window on them to the user in an "advanced mode" or so.
Other possibility, could be a "Kibana timeframe mode", either optimized on "small timeframe" (current behaviour) or "big timeframe" which would maybe feet more the historians use case...

You will have to write a feature request on Github and maybe someone will develop something like this. The problem is that most of the poeple (99,9%) use kibana with a max. timescale of 1 year. So it's not top priortiy I guess.
A vega code generator would be an idea if they don't implement those larger timescales out of the box. Maybe a kibana plugin could help but I am not familiar with those.

Cheers,
defalt

problem is that most of the people (99,9%) use kibana with a max. timescale of 1 year. So it's not top priortiy I guess.

Well probably yes, it'll depend also I guess on the effort/happiness ratio too ...
Implementing Kibana plugin is also an option yes, but I won't have time for it now unfortunatly.

Took a look at the Date Histogram , allowed a larger interval, but that's internally converted to days due to limitations on Elasticsearch side. So the result isn't satisfying and a don't think there's quick way to solve it here, have a look.


will think of a way to solve it differently

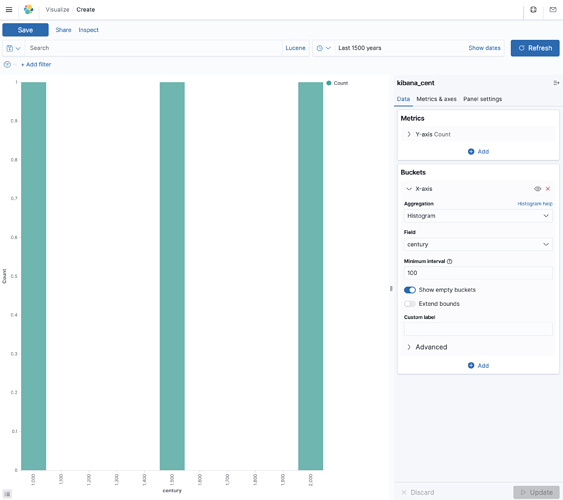
Would it be an option to add e.g. a 'century' field to your data, so you could, use it e.g. like his (3 dates within 1500 years)

Well adding additional 'century' field could be an option yes for antiquity, but for old regime studies (from 5th century to 18th) 5 to 10 years granularity is generally best.

Workaround consist in creating a "Split chart by Filter" and define each decade by hand, but well, that's a bit heavy if user has to defined by hand 300 filters for a chart...!

for this case you could e.g. add a field decade, half_decade, so you would round 1903 to 1900, 1911 to 1910. you could use scripted fields to extract those values at query time, if you do not want to add additional fields to your data
https://www.elastic.co/guide/en/kibana/current/scripted-fields.html

okay thanks, I never used those yet, i'll have a look

Here's a guide for using datetime functions in painless, which is the scripting language of Elasticsearch:

https://www.elastic.co/guide/en/elasticsearch/painless/master/painless-datetime.html

This topic was automatically closed 28 days after the last reply. New replies are no longer allowed.