Kibana version: 8.3.3
Elasticsearch version: 8.3.3
APM Server version: 8.3.3
Opentelemetry java agent: 1.18.0
Steps to reproduce:
- Setup Elasticsearch, Kibana & APM server 8.3.3
- Setup Opentelemetry collector to export otlp to Elastic APM
- Instrumented java application using opentelemetry-javaagent
- Configure application to export oltp telemetry data to Opentelemetry collector
Hi, I have this setup going:
java application (otlp) -> Opentelemetry Collector -> Elastic APM
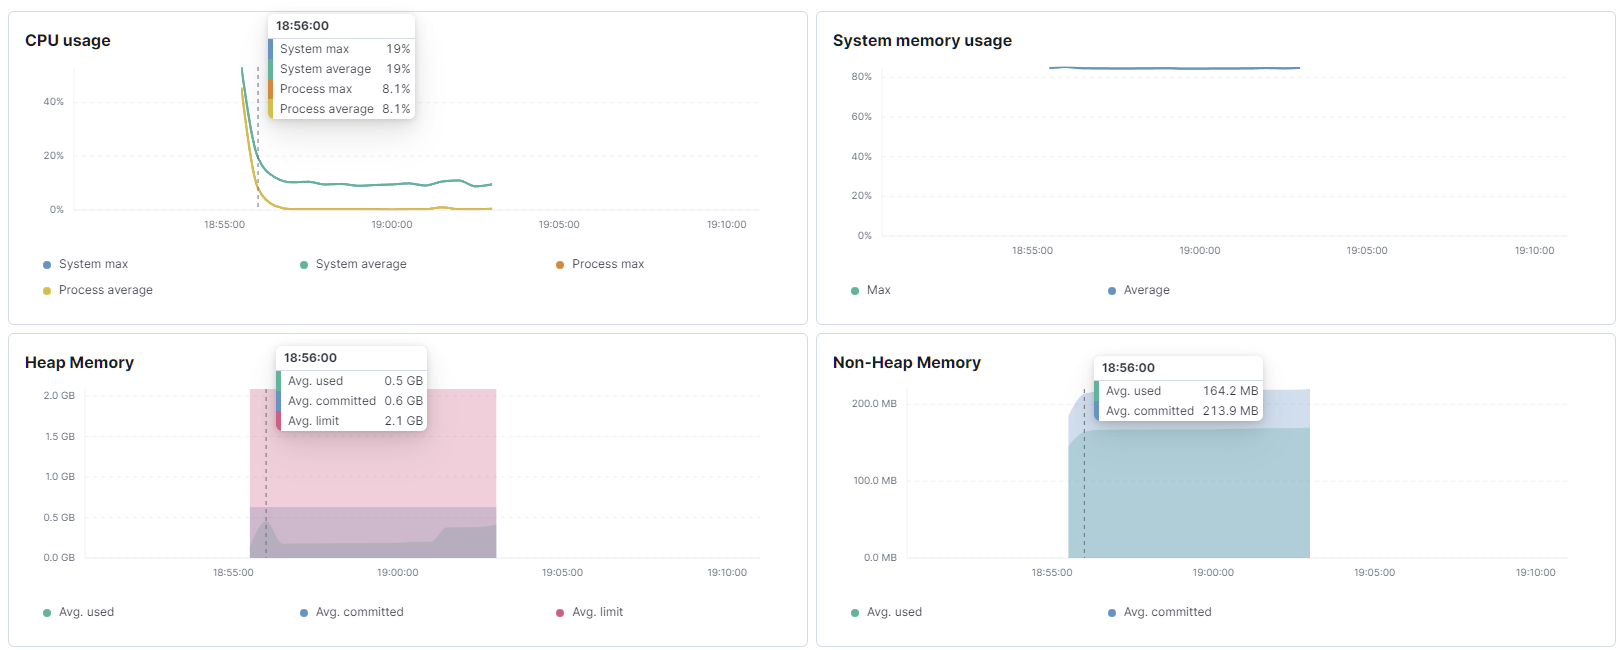
Everything looks fine from Kibana, however I am unable to view any JVM related metrics

I changed the java agent to the Elastic Java agent and exported the telemetry data directly into Elastic APM and it seemed to worked:
Does anyone know whether this is intended behavior for Opentelemetry exported metrics to not show in the JVM tab or is this something I can configure to get it supported?