Dear Team,
We need to check whether counts of specific URL at specific hour is crossing the average value of last week for that specific hour.
Example,

As shown in above charts, we need to highlight when the average count of One day [Highlighted in 2nd table] is higher than the average count of last week[Highlighted in 1st table]
For that we have created two visualizations:
Image 1---
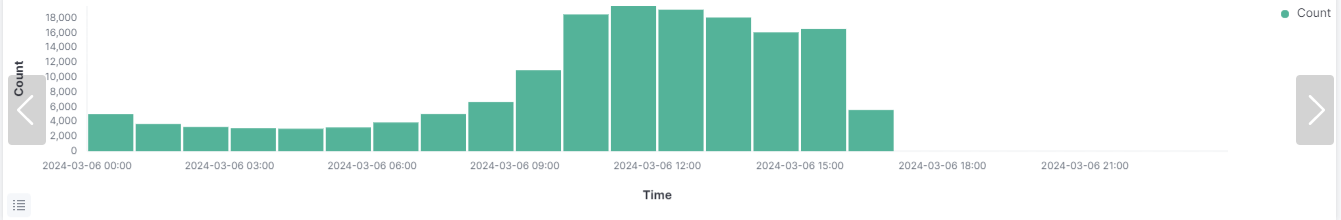
Image 2---Average of Counts of last week data (Hourly Basis)

We need to add benchmark line of average in first visualization i.e.Total Counts per hour. Kindly note that average value can be different for each hour as we are taking hourly basis average.
How can we call the average value from one visualization and set it as threshold in another visualization. Please let me know if it is possible or not. Is there any other way to achieve this requirement with another type of visualization?