Updated the index mapping to add new field of type keyword.
Waited for new index to be created.
Refreshed the index pattern in Kibana.
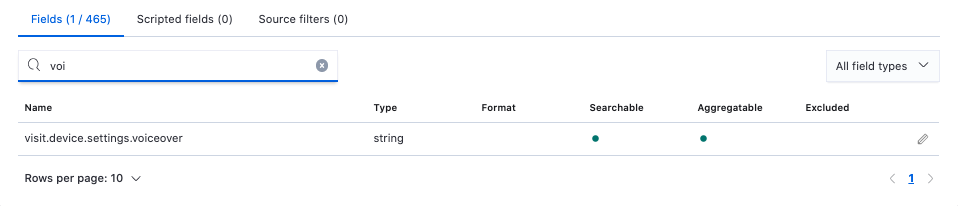
Searched for that field in the Field list in kibana.
field is string, searchable and aggregatable
Field shows up as unknown field in discover
When trying to create a visualization and aggregate by this field, I cannot find the new field in terms list.
Side note: when refreshing the index pattern, the field would show up then disappear a few moments later, at which point I would have to refresh the index pattern again.
Upon further inspection, I am seeing the following error in Kibana logs when trying to refresh the index_pattern:
{"type":"error","@timestamp":"2021-02-11T17:15:51Z","tags":[],"pid":16,"level":"error","error":{"message":"Internal Server Error","name":"Error","stack":"Error: Internal Server Error\n at HapiResponseAdapter.toError (/usr/share/kibana/src/core/server/http/router/response_adapter.js:132:19)\n at HapiResponseAdapter.toHapiResponse (/usr/share/kibana/src/core/server/http/router/response_adapter.js:86:19)\n at HapiResponseAdapter.handle (/usr/share/kibana/src/core/server/http/router/response_adapter.js:81:17)\n at Router.handle (/usr/share/kibana/src/core/server/http/router/router.js:162:34)\n at process._tickCallback (internal/process/next_tick.js:68:7)"},"url":{"protocol":null,"slashes":null,"auth":null,"host":null,"port":null,"hostname":null,"hash":null,"search":null,"query":{},"pathname":"/api/saved_objects/index-pattern/8be439c0-cd83-11e8-8da8-33f92a7b1a47","path":"/api/saved_objects/index-pattern/8be439c0-cd83-11e8-8da8-33f92a7b1a47","href":"/api/saved_objects/index-pattern/8be439c0-cd83-11e8-8da8-33f92a7b1a47"},"message":"Internal Server Error"}
Apache, Apache Lucene, Apache Hadoop, Hadoop, HDFS and the yellow elephant
logo are trademarks of the
Apache Software Foundation
in the United States and/or other countries.