I want to deploy notification based on custom query.
For this scenario, I use logstash to fetch data from devices
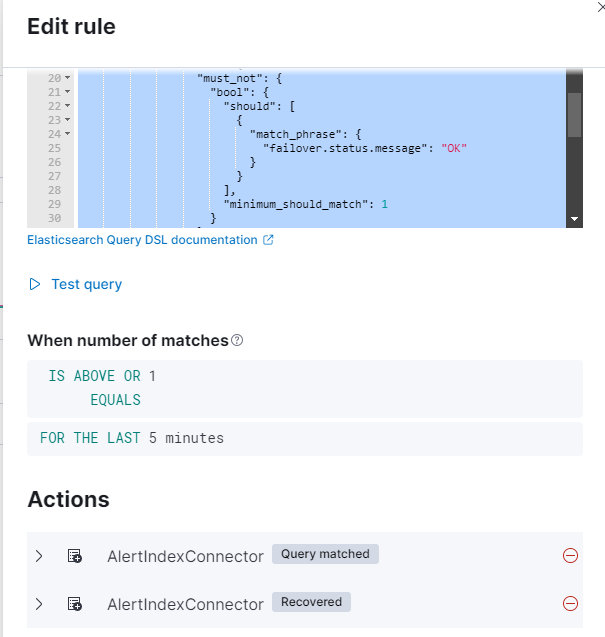
I want to catch all new documents where i.e. the field "failover.status.message" has a different value than "OK". For that purpose, I use the below query and settings in Kibana.
I can get an alert document in the notification index but only for the "Query matched" action. Not when there is Action "Recovery" which I guess should occur when a particular query does not match.
I can get an alert document in the notification index but only for the "Query matched" action. Not when there is Action "Recovery" which I guess should occur when a particular query does not match.
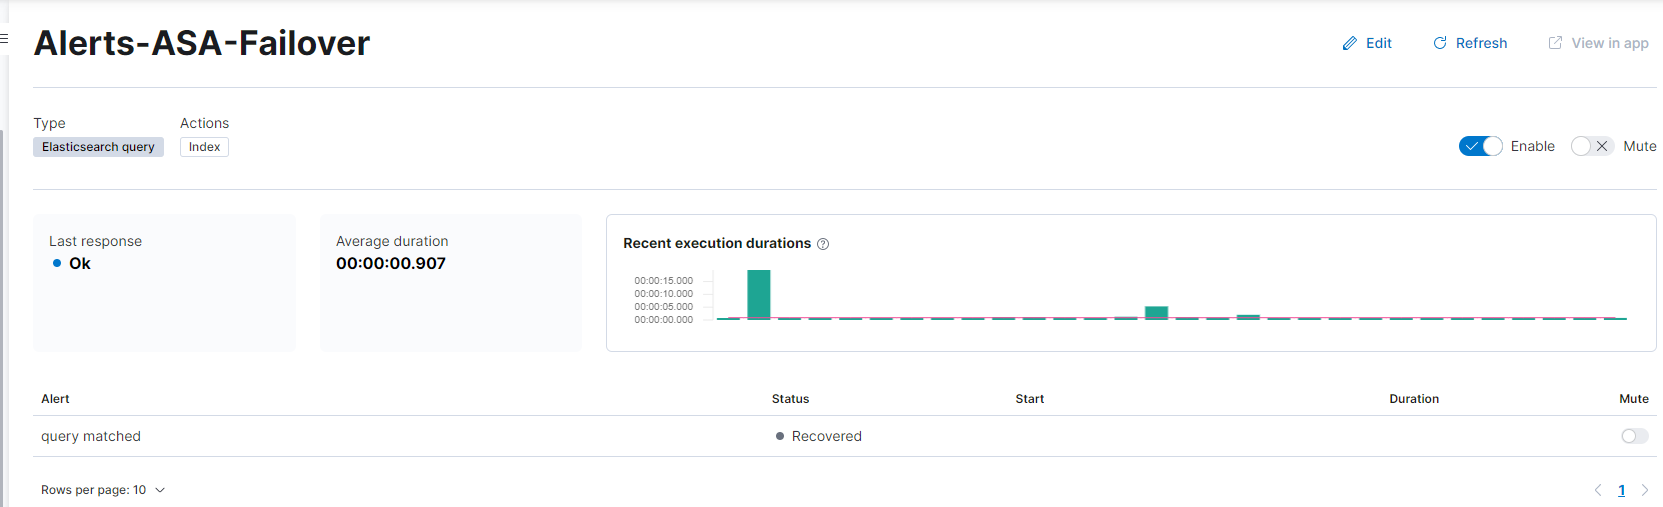
Close - the Recovered action group is only used when the query does not match for an execution, but it did in a previous execution.
From the screenshot showing the rule in a recovered state, I would expected the recovered action should have been run.
Can you check your Kibana logs to see if any errors were reported while executing the actions?
Yes, I can see some error message(foolish of me to not check that in the first place)
{"type":"log","@timestamp":"2022-07-07T13:53:27+00:00","tags":["error","plugins","actions"],"pid":789468,"message":"error indexing documents: failed to parse field [context_date] of type [date] in document with id 'XH3v2IEB2-liSoZO3m8X'. Preview of field's value: '' (cannot parse empty date)"}
[2022-07-07T13:53:27.577+00:00][ERROR][plugins.actions] error indexing documents: failed to parse field [context_date] of type [date] in document with id 'XH3v2IEB2-liSoZO3m8X'. Preview of field's value: '' (cannot parse empty date)
{"type":"log","@timestamp":"2022-07-07T13:53:27+00:00","tags":["warning","plugins","actions"],"pid":789468,"message":"action execution failure: .index:6ffaf080-6fd0-11ec-83ce-ed30ff40c91d: AlertIndexConnector: error indexing documents: failed to parse field [context_date] of type [date] in document with id 'XH3v2IEB2-liSoZO3m8X'. Preview of field's value: '' (cannot parse empty date)"}
{"type":"log","@timestamp":"2022-07-07T13:53:27+00:00","tags":["error","plugins","actions"],"pid":789468,"message":"Action '6ffaf080-6fd0-11ec-83ce-ed30ff40c91d' failed and will not retry: error indexing documents"}
[2022-07-07T13:53:27.578+00:00][WARN ][plugins.actions] action execution failure: .index:6ffaf080-6fd0-11ec-83ce-ed30ff40c91d: AlertIndexConnector: error indexing documents: failed to parse field [context_date] of type [date] in document with id 'XH3v2IEB2-liSoZO3m8X'. Preview of field's value: '' (cannot parse empty date)
[2022-07-07T13:53:27.579+00:00][ERROR][plugins.actions] Action '6ffaf080-6fd0-11ec-83ce-ed30ff40c91d' failed and will not retry: error indexing documents
We are adding support for context.* variables in recovery actions in upcoming releases, but there will be some context variables for some rules that simply won't be able to be populated.
Since it's complaining about a date field, I'm guessing you used a date field from a context.* variable like context.date or maybe a field from context.hits. I'm not sure once we populate the context variables for recovery actions for this rule type, if hits will be available or not.
If you're just looking for the "current" date, you can use the mustache variable date.
To debug this some more, you might want to take the JSON body you're using with the index action, and use it some other action like server log (I think it will mess up the formatting though), email, slack, etc. That way you can see what's being sent to the ES index call.
I have removed all the "context" stuff and now it index recovery document. But there is no way to know what document was used. They could be grouped by host.hostname i.e.
Apache, Apache Lucene, Apache Hadoop, Hadoop, HDFS and the yellow elephant
logo are trademarks of the
Apache Software Foundation
in the United States and/or other countries.