Hello Everyone
Is there a way to represent data as 0 instead of No result found status.
Thanks
Sam
Hello Everyone
Is there a way to represent data as 0 instead of No result found status.
Thanks
Sam
Are you talking about some kind of Visualization in Kibana?
It might depend on what kind of Visualization it is. Looking at a Line Chart, I don't think there is a way. There might possibly be a work-around in some visualization types to do that.
I think Timelion has a function to default value to 0 (or anything you want) in place of missing data. And the new Visual Builder visualization might have that too. But I'll wait to hear what visualizations you're using to go into that.
Hi @LeeDr
Thank you for quick response. So here i am just using and data table visualization to visualize data. So it will just state No result found when there is no data instead if there is a way around to make that field show 0 instead of No result found 
Sorry, but I'm not seeing any way to show 0 instead of "No results found". Showing 0 might be misleading in some cases (like if you're plotting average temperature) so it would have to be a configurable option.
Thats true @LeeDr. But if you can suggest me some way around for this at this point. Because it is doesnt sound right either like showing No result found when you are getting the data but it is just 0.
Thanks,
Sam
What version of Kibana are you using?
I just found this issue which implies it might work depending on your version;
Hi @LeeDr
I am using Kibana 6.0.0 but it is not fixed in it as the post suggest. I am still seeing No result found instead of count 0. If you could help me the work around for how it is appearing in post will be really helpful. I am looking for result exactly as it is shown in the post.
@LeeDr This is just possible in Metric Visualization. But if you choose table as visualization which also shows count and if your result if appearing zero than it will give you No result found instead of stating count of that field as 0
I just created a Data Table visualization on the latest 6.2.0 release. If I put a filter in the query bar which doesn't match any docs the data table shows 0, not No Results Found. I also shifted my time picker to a point where there's no data and got 0.
I could go back and try 6.0.0.
But could you also post a screenshot showing your Data Table visualization configuration (expand the metrics and aggregations on the left panel) so that we can see if there's something unique about your visualization.
I'll also note that if I click the little arrow under Data Table I can get to the request and response of the query sent to Elasticsearch. And in this case I can see that Elasticsearch didn't return the number "0" as a result. It returned 0 hits.
But unfortunately I don't think you can get to this panel with the response when the screen shows "No results found".
I did some more testing and I can see cases where it wouldn't make any sense to show 0 as the result.
In this case I did a simple Terms aggregation on extension.raw. In this first screenshot I have 5 terms with their counts;
Now I use the arrows around my timespan in the top right corner to shift forward in time. And at this point in time there are only 2 extensions found in the docs. So if can't show a count of 0 for extension type php because it doesn't even know that's a term in this timespan;
If I click forward in time once more, I get the No results found message. It can't show 0 because what term would it associate the count of 0 for?

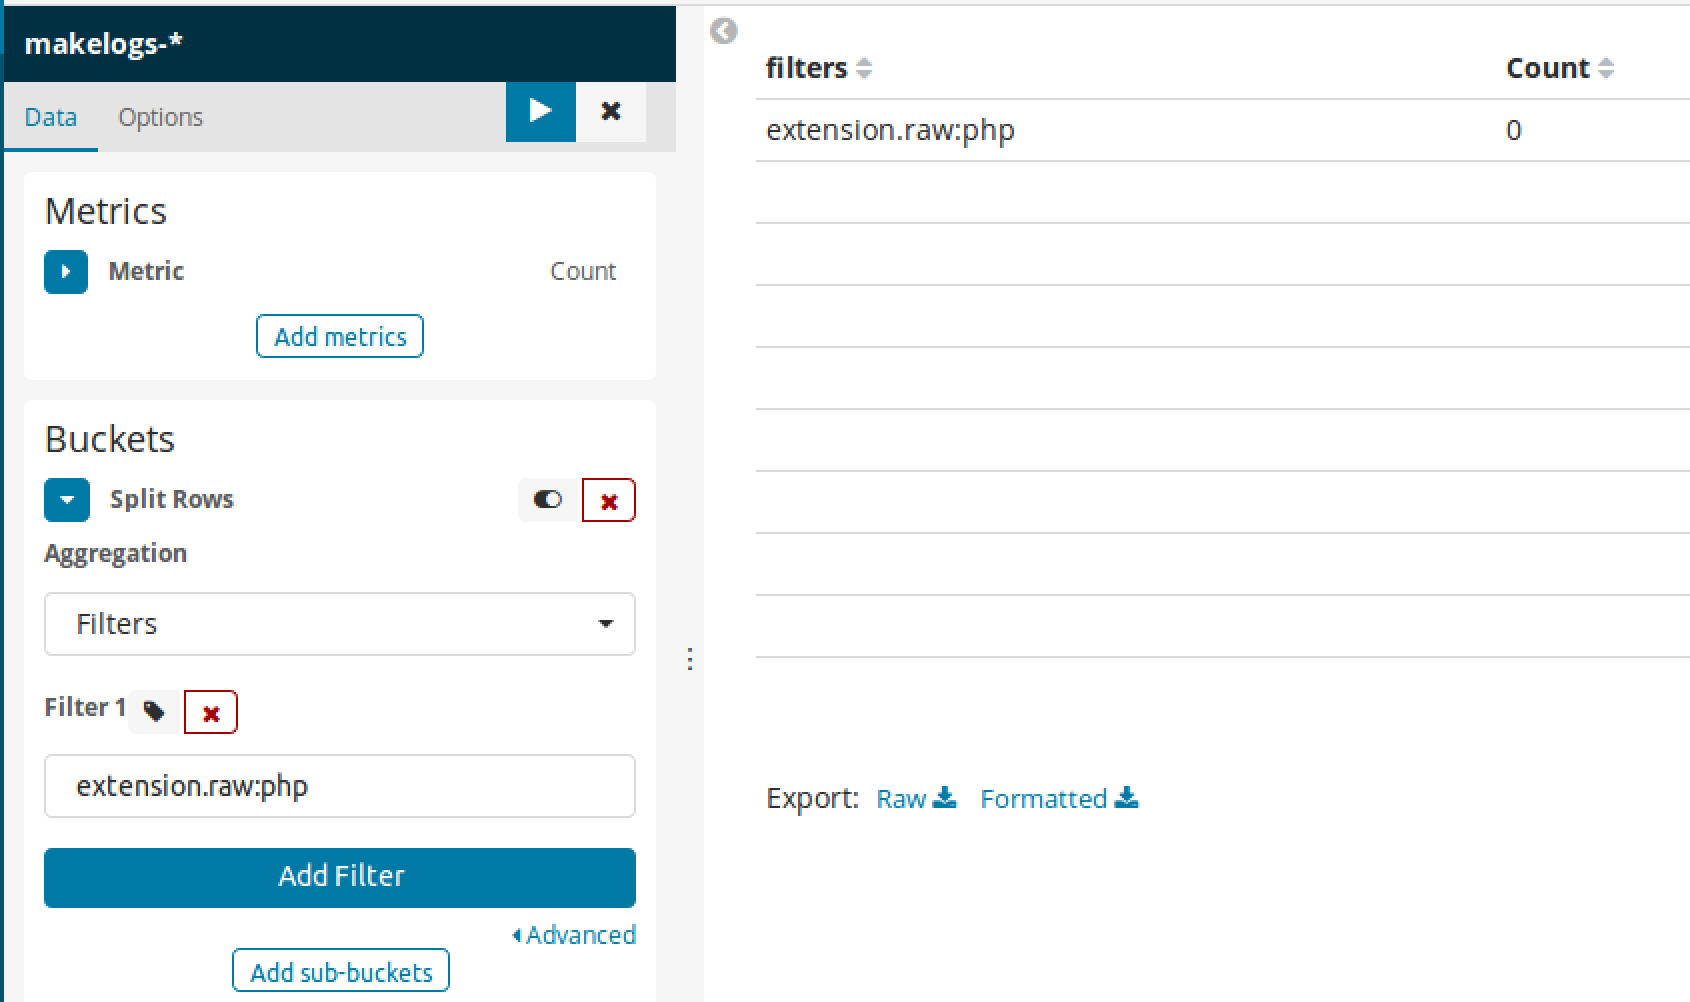
If I change and use a Filters aggregation, then I can create a similar chart by filtering each of the terms I'm interested in (I have to know a fixed set of terms in this case). And it will show 0 if no docs match that term.
And here is a similar case in a Data Table;
Hi @LeeDr Thank you for your prompt reply and testing my case. So I can see Data Table Panel which you showed in pictures. I can also see Response. Now in my case i have used table visualization which shows some result with default metric count. Further when i am applying filter query which is provided with option Add a Filter, i am adding multiple filters now when i do that if the field which i am filtering for is not present with the filter combination which i have defined then it should show me count 0 rather than just showing No result found or empty table. Because default metric is count which is shown so when that field is not present when combination of filter is defined than it should just show 0 instead of showing No rwsult found as i can see the response panel below this message
© 2020. All Rights Reserved - Elasticsearch
Apache, Apache Lucene, Apache Hadoop, Hadoop, HDFS and the yellow elephant logo are trademarks of the Apache Software Foundation in the United States and/or other countries.