I was attempting to see whether kibana.service was listed twice but I don't see it at all. Perhaps something is happening with the kibana.service script that is starting it twice.
You could try starting kibana without systemctl
I was attempting to see whether kibana.service was listed twice but I don't see it at all. Perhaps something is happening with the kibana.service script that is starting it twice.
You could try starting kibana without systemctl
In the previous images Kibana was stopped. When I start and review it, there are no two instances of kibana, only one.
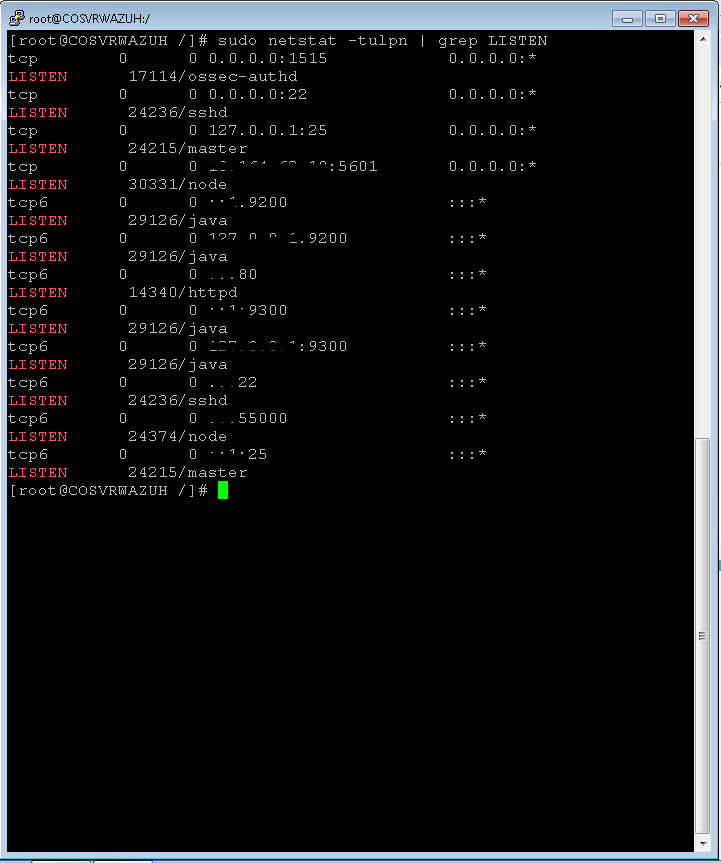
I started kibana with: sudo -i service kibana start but I get the same answer in the browser
I wonder if we're looking at the wrong logs or if I'm not seeing enough of the logs. Could you post more log data to a gist - https://gist.github.com/ ?
I have sent all the information that the system shows and I don't have access to github for security reasons. 
What kind of information do you need?
Your screenshot of the error only shows one or two lines of the log. It may be helpful to have the lines that proceed that error.
That seems to show Kinabalu up and running. Can you connect to it?
Sorry but I don't recognize kinabalu.
Could you tell me what it is and how to get in? The one that registers in port 5601 is that of active kibana, but I don't know which one is kinabalu
Sorry, that was an autocorrect error. Can you connect to kibana?
When I start the service, the status is active, but I cannot access it from another host since the error comes up: the kibana server is not ready yet
Can you show me the last 50 lines from the kibana logs?
when I have access to the server again I will, thank you very much for your help
thanks for solving the issue.
thanks for solving the issue!
This is logs from systemctl -l status kibana
 â kibana.service - Kibana
       Loaded: loaded (/etc/systemd/system/kibana.service; enabled; vendor preset: disabled)
       Active: active (running) since Fri 2019-10-04 17:40:09 EDT; 2 days ago
     Main PID: 30331 (node)
       CGroup: /system.slice/kibana.service
               ââ30331 /usr/share/kibana/bin/../node/bin/node --no-warnings --max-http-header-size=65536 /usr/share/kibana/bin/../src/cli -c /etc/kibana/kibana.yml

Oct 07 09:13:52 COSVRWAZUH kibana[30331]: {"type":"log","@timestamp":"2019-10-07T13:13:52Z","tags":["warning","elasticsearch","admin"],"pid":30331,"message":"Unable to revive connection: http://10.164.62.18:9200/"}
Oct 07 09:13:52 COSVRWAZUH kibana[30331]: {"type":"log","@timestamp":"2019-10-07T13:13:52Z","tags":["warning","elasticsearch","admin"],"pid":30331,"message":"No living connections"}
Oct 07 09:13:52 COSVRWAZUH kibana[30331]: {"type":"log","@timestamp":"2019-10-07T13:13:52Z","tags":["warning","task_manager"],"pid":30331,"message":"PollError No Living connections"}
Oct 07 09:13:52 COSVRWAZUH kibana[30331]: {"type":"log","@timestamp":"2019-10-07T13:13:52Z","tags":["warning","elasticsearch","admin"],"pid":30331,"message":"Unable to revive connection: http://10.164.62.18:9200/"}
Oct 07 09:13:52 COSVRWAZUH kibana[30331]: {"type":"log","@timestamp":"2019-10-07T13:13:52Z","tags":["warning","elasticsearch","admin"],"pid":30331,"message":"No living connections"}
Oct 07 09:13:53 COSVRWAZUH kibana[30331]: {"type":"log","@timestamp":"2019-10-07T13:13:53Z","tags":["warning","elasticsearch","admin"],"pid":30331,"message":"Unable to revive connection: http://10.164.62.18:9200/"}
Oct 07 09:13:53 COSVRWAZUH kibana[30331]: {"type":"log","@timestamp":"2019-10-07T13:13:53Z","tags":["warning","elasticsearch","admin"],"pid":30331,"message":"No living connections"}
Oct 07 09:13:54 COSVRWAZUH kibana[30331]: {"type":"log","@timestamp":"2019-10-07T13:13:54Z","tags":["warning","elasticsearch","data"],"pid":30331,"message":"Unable to revive connection: http://10.164.62.18:9200/"}
Oct 07 09:13:54 COSVRWAZUH kibana[30331]: {"type":"log","@timestamp":"2019-10-07T13:13:54Z","tags":["warning","elasticsearch","data"],"pid":30331,"message":"No living connections"}
Oct 07 09:13:54 COSVRWAZUH kibana[30331]: {"type":"log","@timestamp":"2019-10-07T13:13:54Z","tags":["license","warning","xpack"],"pid":30331,"message":"License information from the X-Pack plugin could not be obtained from Elasticsearch for the [data] cluster. Error: No Living connections"}It looks like kibana is unable to connect to elasticsearch. Is elasticsearch running and available at that IP address and port number?
I could already enter, the error is in elasticsearch.yml since network.host was in localhost.
I modified this field with the server address, restarted the services and the interface of kibana start on the windows machine.
Thank you very much for your help
Hi @mattkime, now that I was able to access the Kibana GUI, I need credentials to enter it. I already installed nginx based on this link https://documentation.wazuh.com/3.10/learning-wazuh/build-lab/kibana-setup.html? but I have not succeeded in accessing kibana, since it does not request authentication credentials.
Thanks for your attention
So you're currently attempting to access Kibana via nginx, correct? Have you been able to access it directly?
Mmm I am not sure if I am accessing through nginx, since I configured it but I still access with the server address and port 5601
Could you inform me if I am accessing correctly or how is the correct way?
© 2020. All Rights Reserved - Elasticsearch
Apache, Apache Lucene, Apache Hadoop, Hadoop, HDFS and the yellow elephant logo are trademarks of the Apache Software Foundation in the United States and/or other countries.