I have some problems with EST5EDT timezone in Kibana v 7.17.0:
So, when I set timezone to UTC on the "Slack Management -> Advanced Settings" page - everything works fine and I see data with correct timezone. But when I set timezone to EST5EDT - data is displayed in my browser timezone.
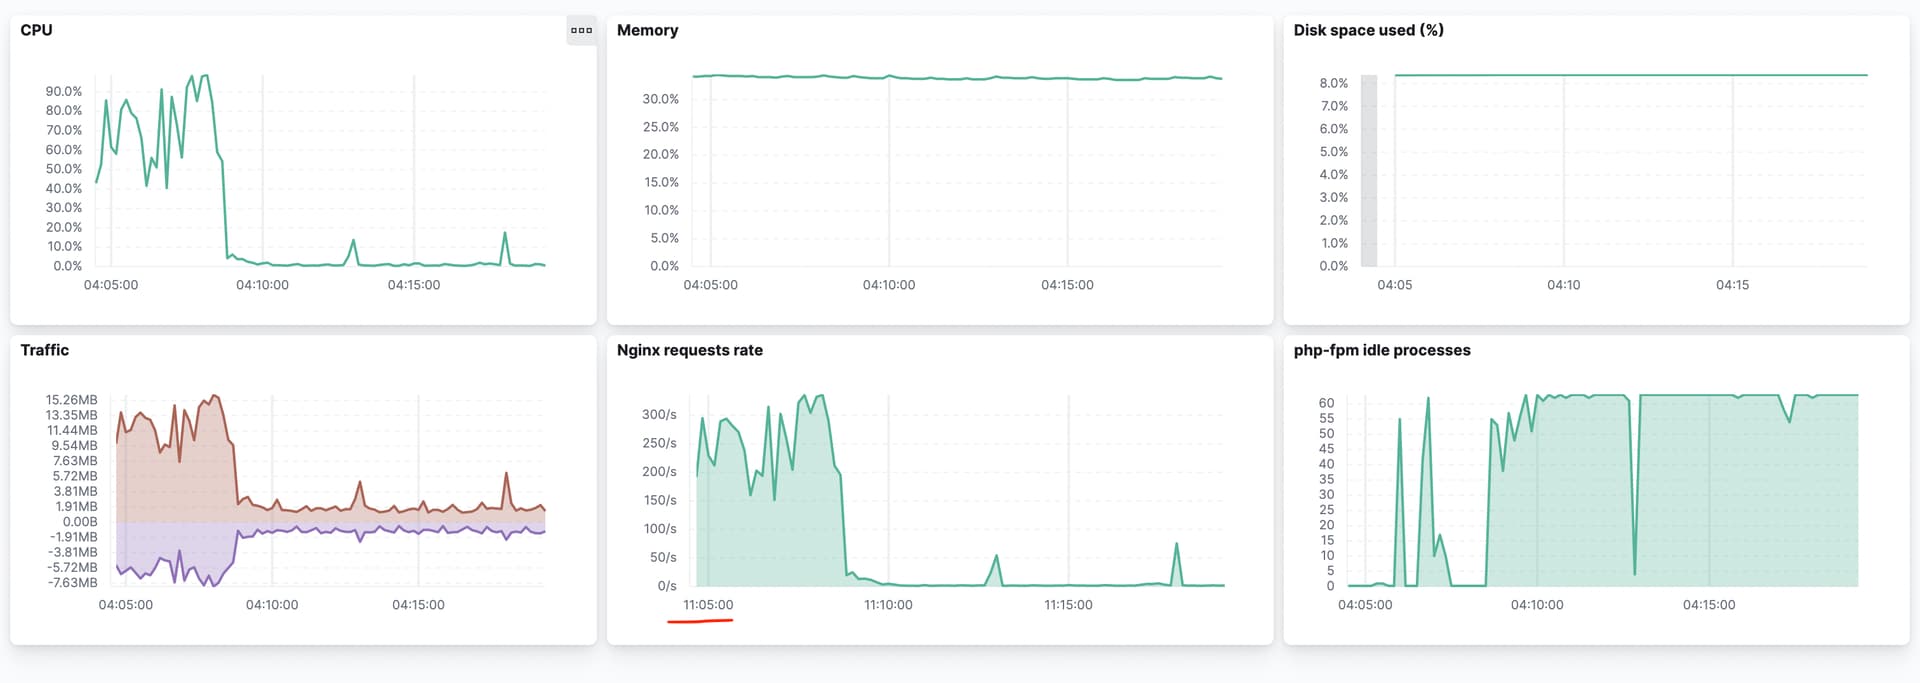
I tried to set it back and forth to EST5EDT manually a few times, and behavior was kind of random: graphs on my dashboard were alternating between EST5EDT and my browser timezone (GMT+3) :
I can't see anything unexpected in there. Does the problem persist after clearing the cache and reloading the dashboard (or opening it in a private browsing window?)
Thanks for reporting this and for staying with us on investigating the problem.
I'd like to check few more things on your end to frame better the problem:
do you have any particular browser extension that can interfere with the page (like Tampermonkey)
if you open to edit one of the visualizations that is showing the time in the wrong timezone, do you see same problem?
can you click on the gear icon on top/right corner of a good and a bad visualization and click Inspect, then View: Requests and then switch to the Request tab. Can you please share copies of the requests for a good and bad visualizations? (please hide/remove everything that can't be publicly shared)
do you have any particular browser extension that can interfere with the page (like Tampermonkey)
No. I just checked with my phone, same issue.
if you open to edit one of the visualizations that is showing the time in the wrong timezone, do you see same problem?
yes, on lens edit screen data also has my local timezone
can you click on the gear icon on top/right corner of a good and a bad visualization and click Inspect, then View: Requests and then switch to the Request tab. Can you please share copies of the requests for a good and bad visualizations? (please hide/remove everything that can't be publicly shared)
I can't find a good visualization right now, all of them show data in my local TZ. This one is for bad visualization:
Thanks @lifer
The requests look correct, I don't see any problem here. I also checked the exported saved object and also there I don't see any issue at all related to some improperly configured timezone.
I tried to replicate the issue locally on a 7.17.0 instance, importing and exporting visualizations and dashboards from different spaces/kibana instances with different timezone and I can't replicate the behaviour.
I can keep looking at what is going on but it's hard if we can't replicate it on our side.
I have a few more questions to see if something else comes out:
Do you see any error on the chrome dev console that can be related to that problem?
You already probably know that, but it worth trying: the timezone configuration on the advanced setting is per Space, so if this is reproducible only in one space, it means that this space can be compromized some how. Can you double check that the advanced settings you are changing is the one related to the space where the dashboard and visualizations are saved? I know it sounds obvious, but sometimes you are operating with spaces with similar logos/icons/color and you can confuse them (this doesn't solve the problem related to the fact that only some viz are showing time in a different timezone but it's worth trying)
what happen if you recreate from scratch one visualization? does it follows the timezone configured?
Apache, Apache Lucene, Apache Hadoop, Hadoop, HDFS and the yellow elephant
logo are trademarks of the
Apache Software Foundation
in the United States and/or other countries.