Hi, I have 2 question regarding latency and response time in Elasticsearch.
- Why on different monitoring clients there are different response time?
For example in Kibana average request time is 700ms:

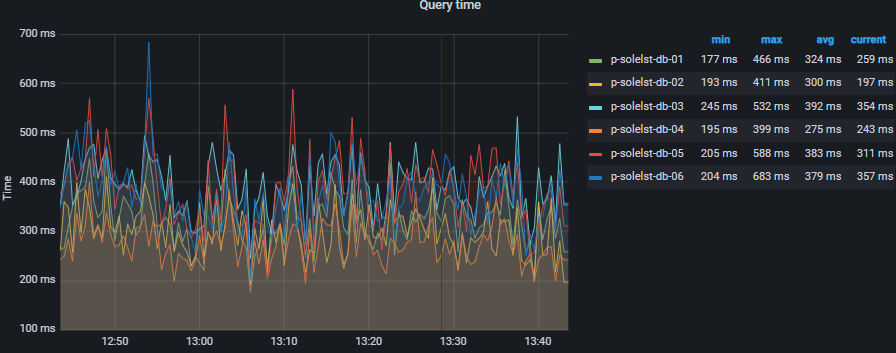
In Graphana average request time is about ~300-500ms:
In Dynatrace it's about 100-150ms, though I'm not sure if its measure it correctly:

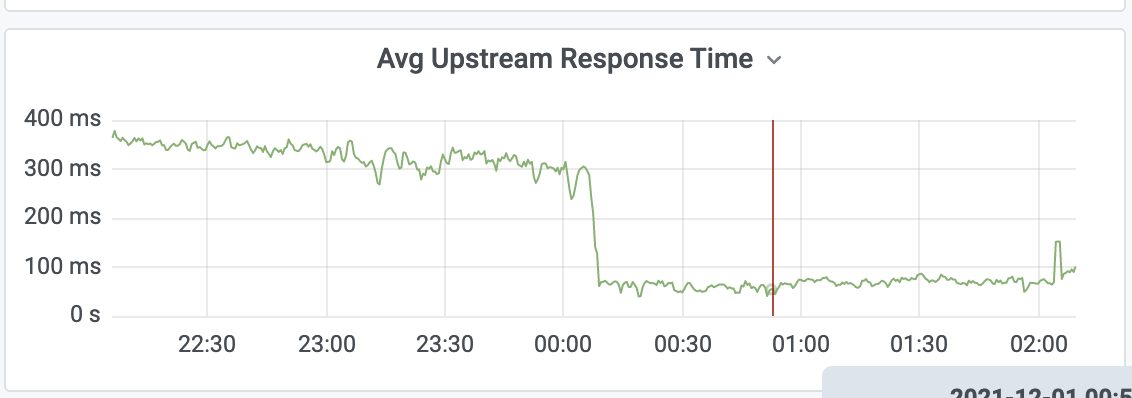
- Why response time suddenly changed?
We've average response time in a cluster about 400ms, but after the new mapping update (we added 3 new fields), response time decreased to 100-250 ms, and kept it that way throughout the day.
The next day, the response time increased again
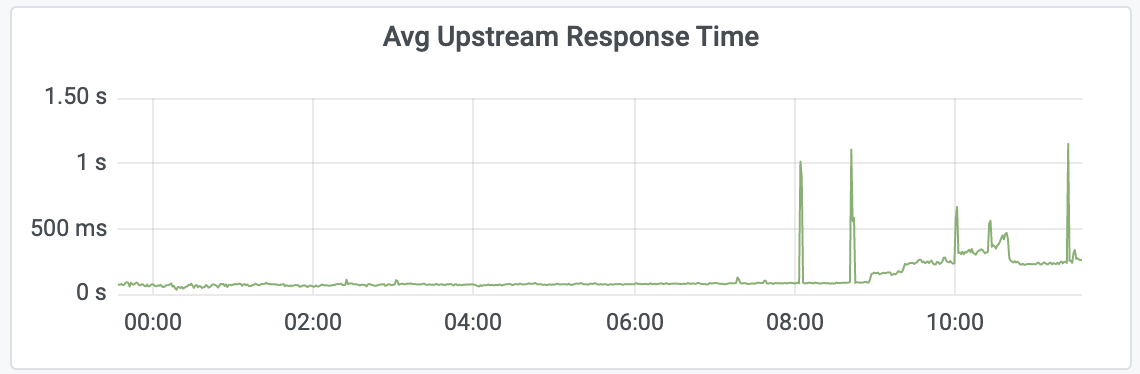
What could cause a decrease in response time after updating the mapping? And why did the response time rise back?
Thanks!