As you can see the average depicted (green line) is above the maximum values. It is not the actual average, instead it represents the raw average values, that is, the sums.
thanks for reaching out. To handle rollups correctly in visualizations, it's necessary to create a rollup index pattern. If you go into Management > Index patterns and press "Create new index pattern" you should be able to select rollup index pattern from the context menu. This will tell Kibana to do the conversion described in ES 6.3.2 Rollup avg metric does a sum instead?. It will also hide the technical field names like usage_average.avg.value and show you the regular field names which makes it possible to create visualizations as if the data isn't even rolled up - with the only difference that the aggregations you didn't activate in your rollup configuration will be greyed out.
Could you check whether the index pattern you are working with is created as rollup index pattern?
Yes, you are right my index pattern was not of type «rollup index pattern» so this is the explanation of this behaviour.
But if I do define such a index pattern I am able to see correctly the average of all my records but I cannot use the terms to parition the data, in this case by hosts (tag.source.keyword.terms.value). This field has a «?»
I get the following error:
The types of the fields are not well recognized in the visualization page:
Even refreshing the field list does not change anything in the visualization page above.
As a workarround I have used calculated fields in the old index pattern (normal type, not rollup) to get the average as the sum/count, and in this way I can visualize the average cpu per host. I do not know if this is a good solution in terms of efficiency.
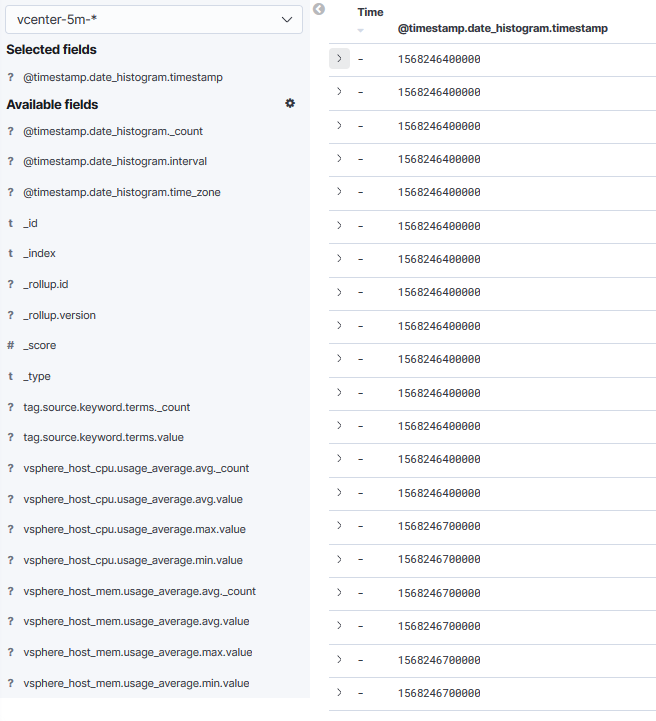
tag.source.keyword.terms.value is the technical field, you should not work directly with this. When configuring the visualization it should be possible to pick tag.source.keyword, then it should work as expected. Make sure to pick the rollup index pattern when creating a new visualization. Also, it looks like the screenshots you posted are from the Discover app, not Visualize.
Discover is expected to show you the "raw" technical fields because it is a tool designed to look at individual documents which isn't possible anymore with rolled up data. It's recommended to use the visualization types in Visualize instead.
Understood, in the Visualize app I can draw a line for all hosts (green line in the picture below is the average cpu), but when I try to filter with a specific host I get an error.
Index pattern of type rollup is: vcenter-5m-*
Filter expression is: tag.source.keyword:nfhhvmadlb01.maqueta
Apache, Apache Lucene, Apache Hadoop, Hadoop, HDFS and the yellow elephant
logo are trademarks of the
Apache Software Foundation
in the United States and/or other countries.