Hello,
Is there a minimum value to have a non null sum?
I have a field with numeric values in the 10**-2 but all my graphs charts are at 0
Thanks
Hello,
Is there a minimum value to have a non null sum?
I have a field with numeric values in the 10**-2 but all my graphs charts are at 0
Thanks
Could you include a couple of source documents and a screenshot of the resulting visualization?
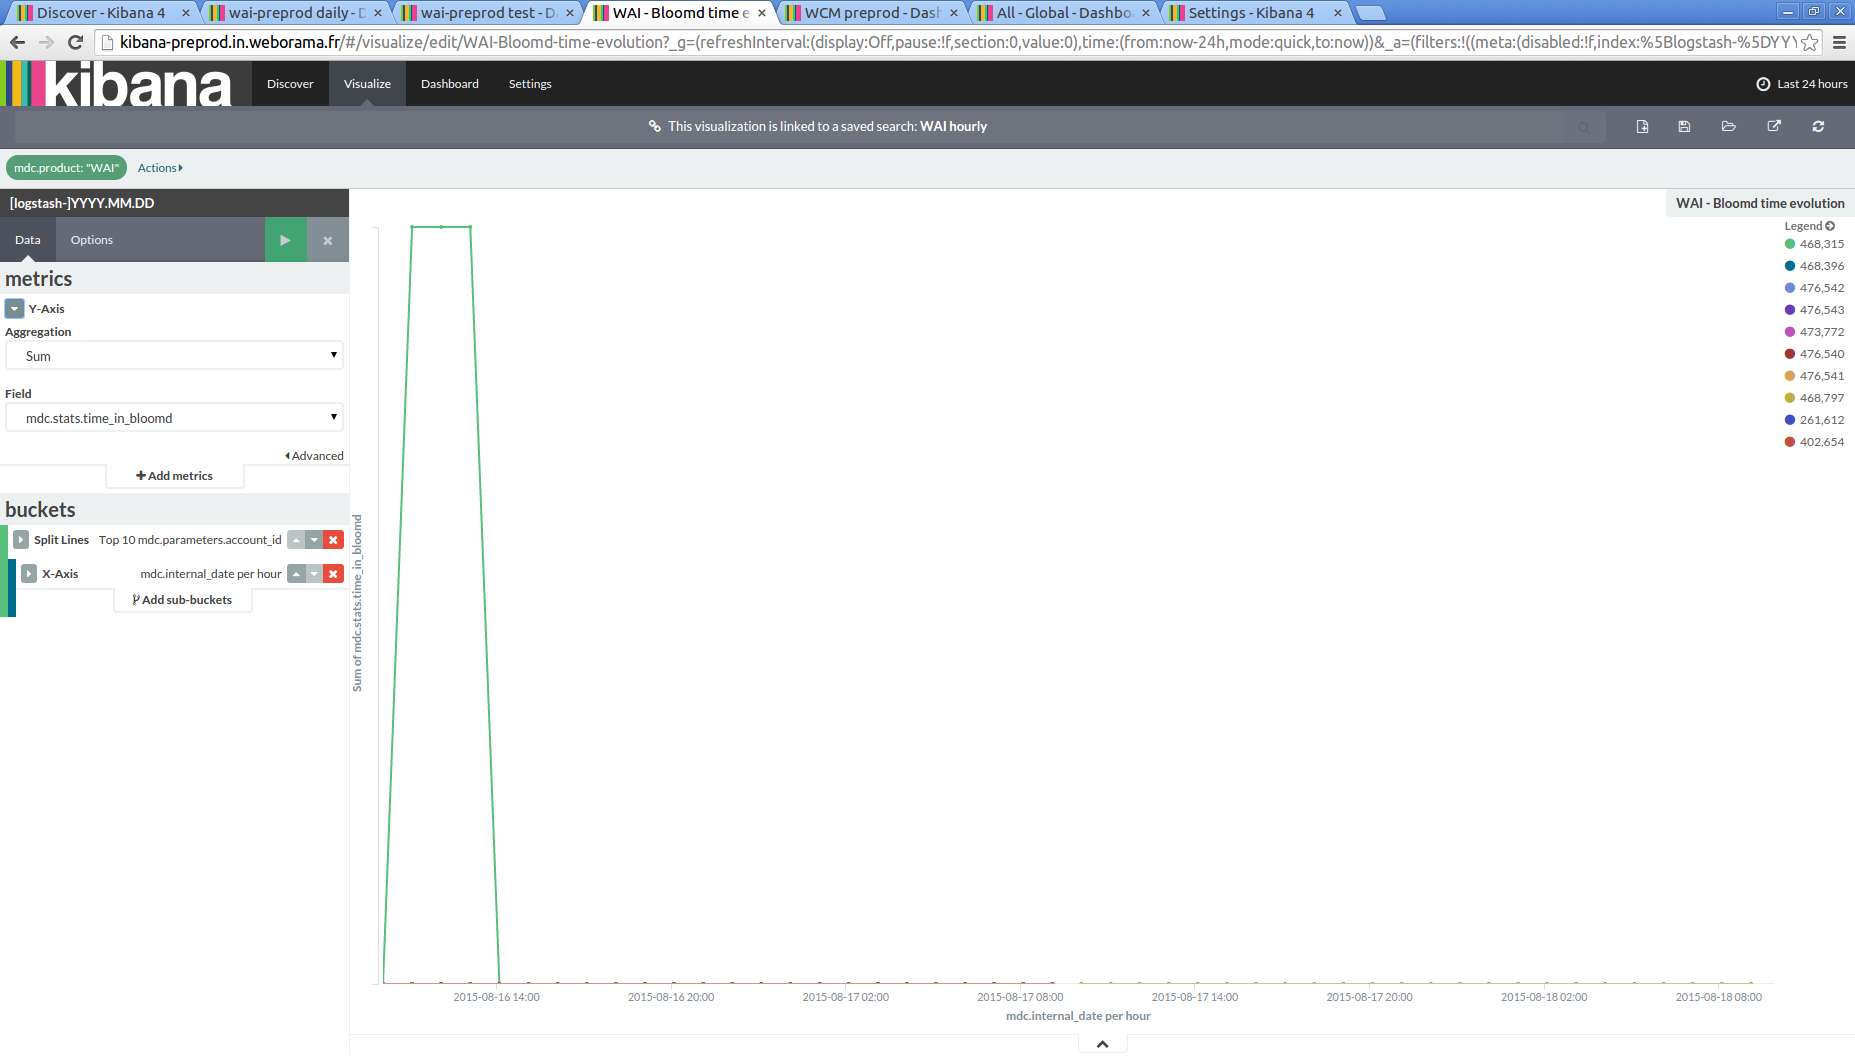
Sure can; I attached a couple of screenshots of the logstash values of the mdc.stats.time_in_bloomd variable, you can see regularly values greater than zero; the corresponding line chart graph suming that variable shows most of the values at zero (the pikes have also zero has value). Is there some rounding, variable type issue??
Similarly the chart graph suming another variable with similar range of values (decimal between 0 an 1) keeps switching from 0 to 1 with no intermediate values.
Thanks
Regards
This means that zeros are stored in Elasticsearch and returned to the UI... Kibana is just displaying what's being stored.
Hello, thanks for your answer; but that is precisely my issue as I have none zero values for that variable as is shown in the first screen shot (values are small but not zeros)...
Also, if values are all zeros, why is the line chart graph displaying these pikes (which values are at zero in the spy).
I have other line chart graphs for which the summation is displayed correctly with small and many zero values.
I attached a new screen shot showing the non zero values for the culprit variable.
Thanks
The Table is displaying the first 10 values, and from the chart those may well be zero. Could you zoom in on one of the spikes, capturing the first zero values and the larger values and share the chart with the spy open? Also, feel free to share the JSON behind one of the sample documents, so one of us could play with it directly.
Thanks for your patience; attached the screen shot of the zoom in for first non zero value (0.039) for the variable (mdc.stats.time_in_bloomd) for the considered time period, and below the corresponding json code:
{
"_index": "logstash-2015.08.20",
"_type": "syslog",
"_id": "AU9LbRMVJhkp33JJWFPy",
"_score": 1,
"_source": {
"message": "<182>Aug 20 14:05:08 compute-1 /usr/local/perl-dists/perls/perl @cee: {"msg":"Account 261622 done","webo_env":"PREPROD","time":1440079508,"subsys":"Weborama::Advertiser::Compute::StatComputation","pname":"advertiser-compute.pl","mdc":{"wcm.unicity.time":0.104957,"stats.time_in_ring.write":0,"wcm.users.huge":0,"wcm.db.flat_conv.write":3.5e-05,"stats.time_in_ring.read":0.062427,"product.project":"Weborama::Advertiser::Compute","wcm.country":"France","stats.compute_time":18.6675,"stats.time_in_ring":0.062427,"parameters.account_id":261622,"wcm.unicity.calls":36,"wcm.users.total":23,"stats.time_in_redis.read":0.121336,"wcm.actions.total":169,"wcm.users.ring":1,"stats.time_in_redis":0.210939,"wcm.profils.ring":4,"stats.time_in_redis.write":0.089603,"stats.impression":22,"wcm.users.undef":14,"stats.time_in_bloomd":0.039323,"wcm.profils.redis":23,"wcm.users.spiders":0,"wcm.users.redis":8,"product":"WCM","stats.click":2,"stats.time_in_sql.write":5.642948},"pri":"INFO","host":"compute-1"}\n",
"@version": "1",
"@timestamp": "2015-08-20T14:04:43.654Z",
"type": "syslog",
"host": "compute-1",
"tags": [
"_grokparsefailure_sysloginput",
"weborama"
],
"priority": 0,
"severity": 0,
"facility": 0,
"facility_label": "kernel",
"severity_label": "Emergency",
"json_log": "{"msg":"Account 261622 done","webo_env":"PREPROD","time":1440079508,"subsys":"Weborama::Advertiser::Compute::StatComputation","pname":"advertiser-compute.pl","mdc":{"wcm.unicity.time":0.104957,"stats.time_in_ring.write":0,"wcm.users.huge":0,"wcm.db.flat_conv.write":3.5e-05,"stats.time_in_ring.read":0.062427,"product.project":"Weborama::Advertiser::Compute","wcm.country":"France","stats.compute_time":18.6675,"stats.time_in_ring":0.062427,"parameters.account_id":261622,"wcm.unicity.calls":36,"wcm.users.total":23,"stats.time_in_redis.read":0.121336,"wcm.actions.total":169,"wcm.users.ring":1,"stats.time_in_redis":0.210939,"wcm.profils.ring":4,"stats.time_in_redis.write":0.089603,"stats.impression":22,"wcm.users.undef":14,"stats.time_in_bloomd":0.039323,"wcm.profils.redis":23,"wcm.users.spiders":0,"wcm.users.redis":8,"product":"WCM","stats.click":2,"stats.time_in_sql.write":5.642948},"pri":"INFO","host":"compute-1"}\n",
"msg": "Account 261622 done",
"webo_env": "PREPROD",
"time": 1440079508,
"subsys": "Weborama::Advertiser::Compute::StatComputation",
"pname": "advertiser-compute.pl",
"mdc": {
"wcm.unicity.time": 0.104957,
"stats.time_in_ring.write": 0,
"wcm.users.huge": 0,
"wcm.db.flat_conv.write": 0.000035,
"stats.time_in_ring.read": 0.062427,
"product.project": "Weborama::Advertiser::Compute",
"wcm.country": "France",
"stats.compute_time": 18.6675,
"stats.time_in_ring": 0.062427,
"parameters.account_id": 261622,
"wcm.unicity.calls": 36,
"wcm.users.total": 23,
"stats.time_in_redis.read": 0.121336,
"wcm.actions.total": 169,
"wcm.users.ring": 1,
"stats.time_in_redis": 0.210939,
"wcm.profils.ring": 4,
"stats.time_in_redis.write": 0.089603,
"stats.impression": 22,
"wcm.users.undef": 14,
"stats.time_in_bloomd": 0.039323,
"wcm.profils.redis": 23,
"wcm.users.spiders": 0,
"wcm.users.redis": 8,
"product": "WCM",
"stats.click": 2,
"stats.time_in_sql.write": 5.642948
},
"pri": "INFO"
},
"fields": {
"compute time per hit": [
0
],
"@timestamp": [
1440079483654
],
"returning user count": [
0
]
}
}
Conversely, the json code for a 0 value:
{
"_index": "logstash-2015.08.21",
"_type": "syslog",
"_id": "AU9QX45uJhkp33JJWNtf",
"_score": null,
"_source": {
"message": "<182>Aug 21 13:08:28 compute-2 /usr/local/perl-dists/perls/perl @cee: {"msg":"Account 261805 done","webo_env":"PREPROD","time":1440162508,"subsys":"Weborama::Advertiser::Compute::StatComputation","pname":"advertiser-compute.pl","mdc":{"wcm.unicity.time":0,"stats.time_in_ring.write":0,"wcm.users.huge":0,"wcm.db.flat_conv.write":2.5e-05,"stats.time_in_ring.read":0,"product.project":"Weborama::Advertiser::Compute","wcm.country":"Colombia","stats.compute_time":2.496746,"stats.time_in_ring":0,"parameters.account_id":261805,"wcm.unicity.calls":0,"wcm.users.total":0,"stats.time_in_redis.read":0.000733,"wcm.actions.total":0,"wcm.users.ring":0,"stats.time_in_redis":0.001508,"wcm.profils.ring":0,"stats.time_in_redis.write":0.000775,"wcm.users.undef":0,"stats.time_in_bloomd":0,"wcm.profils.redis":0,"wcm.users.spiders":0,"wcm.users.redis":0,"product":"WCM","stats.time_in_sql.write":0.000118},"pri":"INFO","host":"compute-2"}\n",
"@version": "1",
"@timestamp": "2015-08-21T13:08:03.699Z",
"type": "syslog",
"host": "compute-2",
"tags": [
"_grokparsefailure_sysloginput",
"weborama"
],
"priority": 0,
"severity": 0,
"facility": 0,
"facility_label": "kernel",
"severity_label": "Emergency",
"json_log": "{"msg":"Account 261805 done","webo_env":"PREPROD","time":1440162508,"subsys":"Weborama::Advertiser::Compute::StatComputation","pname":"advertiser-compute.pl","mdc":{"wcm.unicity.time":0,"stats.time_in_ring.write":0,"wcm.users.huge":0,"wcm.db.flat_conv.write":2.5e-05,"stats.time_in_ring.read":0,"product.project":"Weborama::Advertiser::Compute","wcm.country":"Colombia","stats.compute_time":2.496746,"stats.time_in_ring":0,"parameters.account_id":261805,"wcm.unicity.calls":0,"wcm.users.total":0,"stats.time_in_redis.read":0.000733,"wcm.actions.total":0,"wcm.users.ring":0,"stats.time_in_redis":0.001508,"wcm.profils.ring":0,"stats.time_in_redis.write":0.000775,"wcm.users.undef":0,"stats.time_in_bloomd":0,"wcm.profils.redis":0,"wcm.users.spiders":0,"wcm.users.redis":0,"product":"WCM","stats.time_in_sql.write":0.000118},"pri":"INFO","host":"compute-2"}\n",
"msg": "Account 261805 done",
"webo_env": "PREPROD",
"time": 1440162508,
"subsys": "Weborama::Advertiser::Compute::StatComputation",
"pname": "advertiser-compute.pl",
"mdc": {
"wcm.unicity.time": 0,
"stats.time_in_ring.write": 0,
"wcm.users.huge": 0,
"wcm.db.flat_conv.write": 0.000025,
"stats.time_in_ring.read": 0,
"product.project": "Weborama::Advertiser::Compute",
"wcm.country": "Colombia",
"stats.compute_time": 2.496746,
"stats.time_in_ring": 0,
"parameters.account_id": 261805,
"wcm.unicity.calls": 0,
"wcm.users.total": 0,
"stats.time_in_redis.read": 0.000733,
"wcm.actions.total": 0,
"wcm.users.ring": 0,
"stats.time_in_redis": 0.001508,
"wcm.profils.ring": 0,
"stats.time_in_redis.write": 0.000775,
"wcm.users.undef": 0,
"stats.time_in_bloomd": 0,
"wcm.profils.redis": 0,
"wcm.users.spiders": 0,
"wcm.users.redis": 0,
"product": "WCM",
"stats.time_in_sql.write": 0.000118
},
"pri": "INFO"
},
"fields": {
"compute time per hit": [
0
],
"@timestamp": [
1440162483699
],
"returning user count": [
0
]
},
"sort": [
1440162483699
]
}
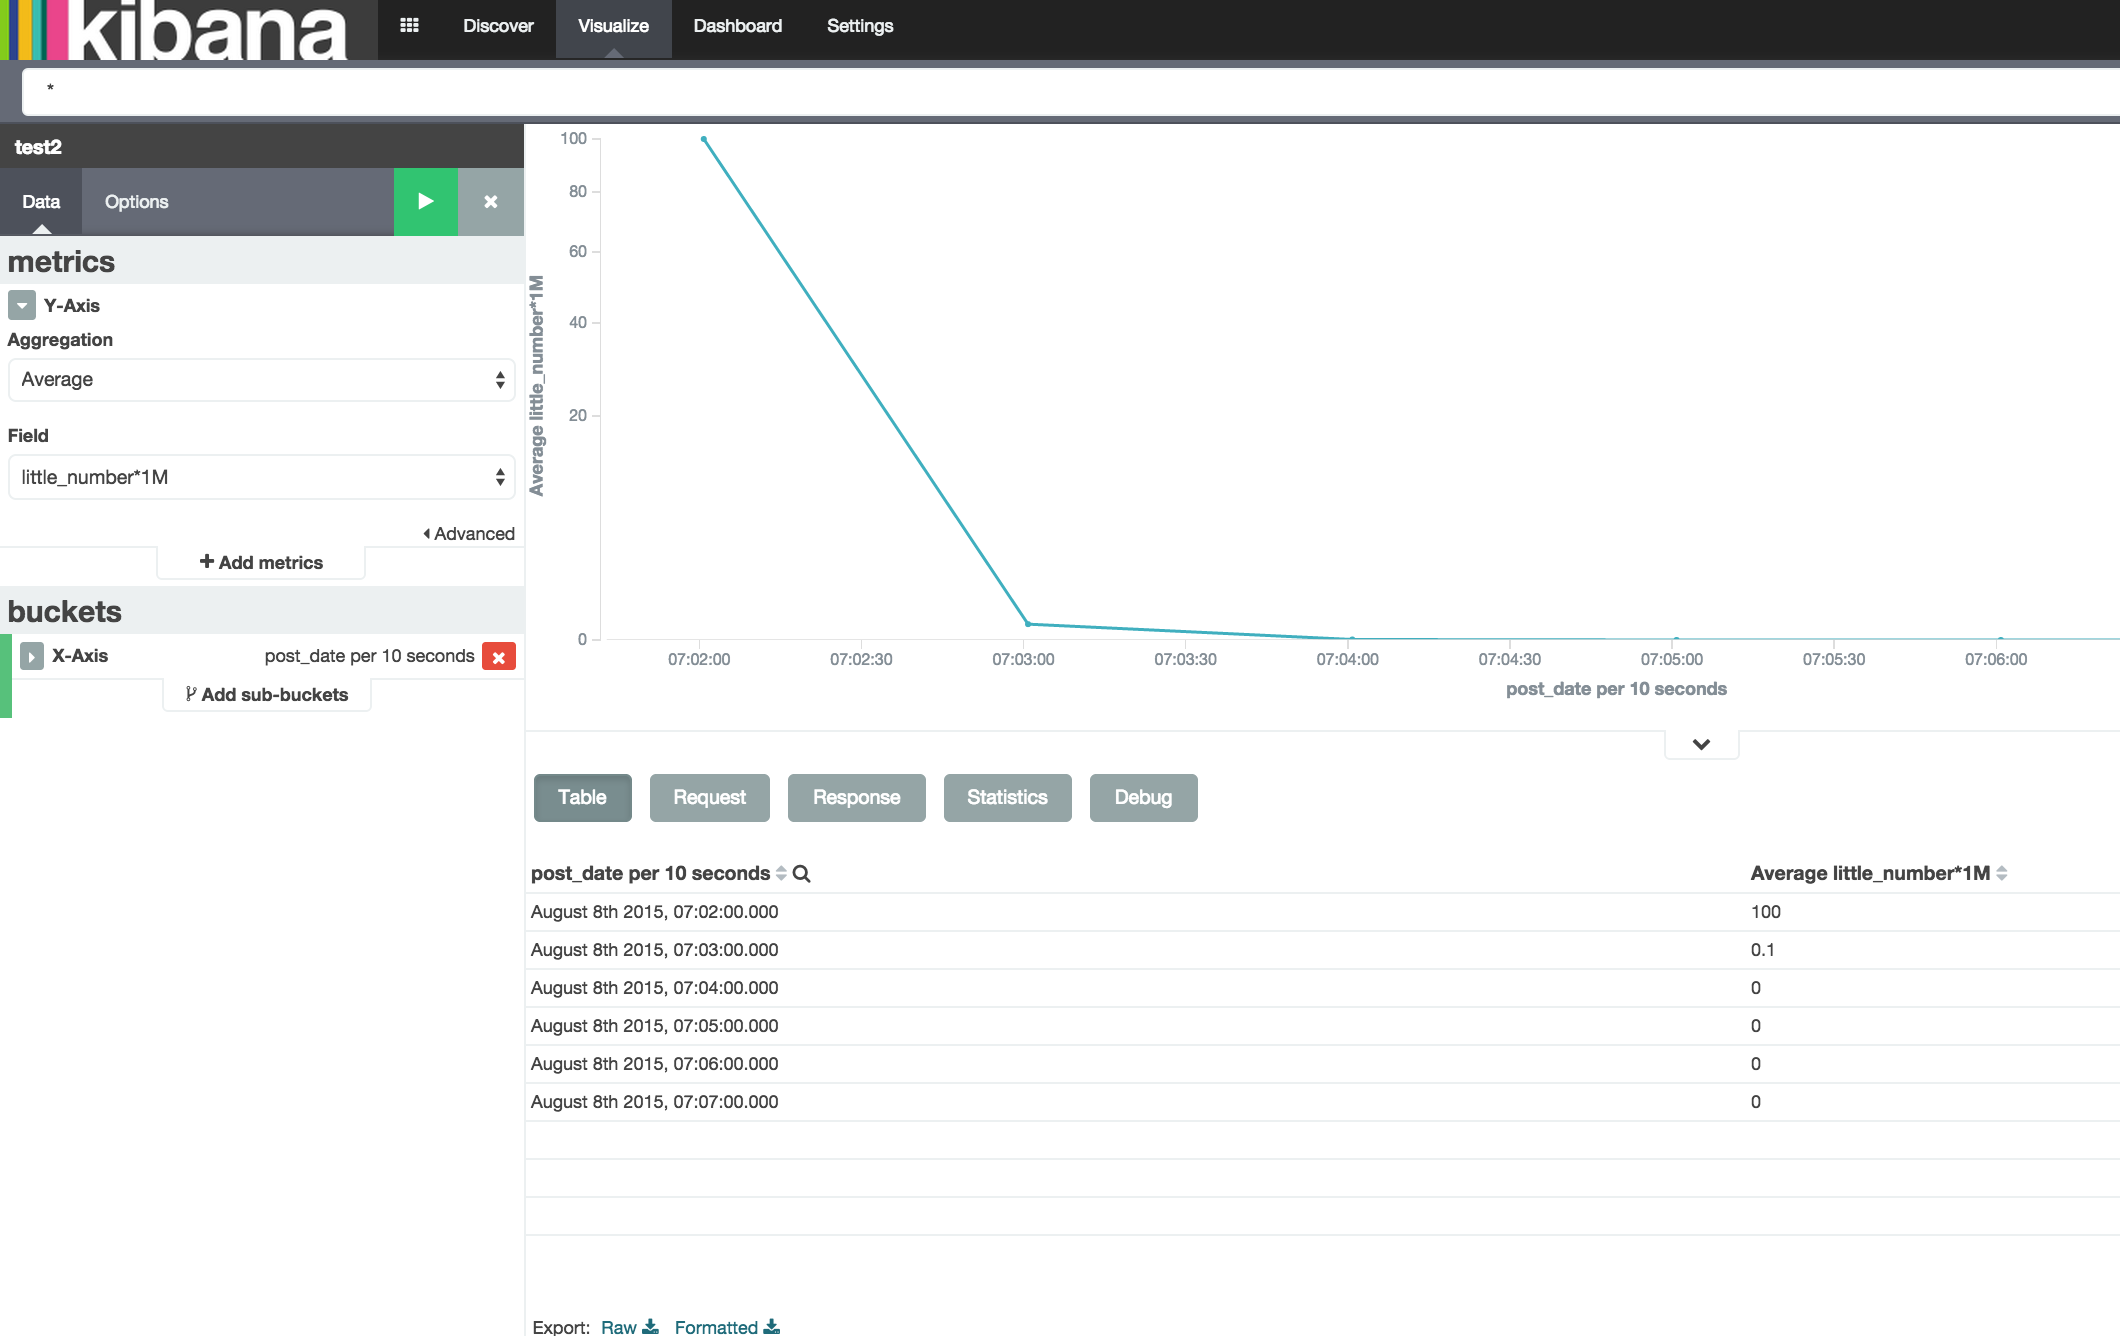
I tested this out using my own data, and I'm getting similarly strange results as you. I filed a bug in the Github repo for Kibana, feel free to add your comments there, if I failed to capture something from your use case: https://github.com/elastic/kibana/issues/4736
As a workaround, you may want to consider scaling your data using scripted fields for now. Also, consider using square root axis scaling for your Y-axis, if you have large order of magnitude differences in the data points.
Great, you summed it up perfectly; we'll probably end up scaling the data.
Regards
Hello, I tried but that did not do the trick; though the data have now plenty of digits in Discover (see SS, right most column), the sum in the Visualize graphs remains the same (0 or 1).
Checking on the Elasticsearch response, I can see that all the values are retrieved by Elasticsearch incorrectly.... so it looks more like an Elasticsearch issue than Kibana one...
I also created a scripted field, multiplying the initial faulty key by 1000, that retrieves values of 0 or 1000 (same way than I had 0 or 1 with the initial key) in the Visualize graphs, though Discover is really out of whack with out of range values (see SS, first column).
Hope this helps
Thanks
Yes, but the field formatter trick discussed in the Github ticket clears up the problem with the sample use case I tried.
© 2020. All Rights Reserved - Elasticsearch
Apache, Apache Lucene, Apache Hadoop, Hadoop, HDFS and the yellow elephant logo are trademarks of the Apache Software Foundation in the United States and/or other countries.