Hi,
I am exploring timelion vis so as to plot a movingaverage graph for my example below:
Log file:(Plane-ID and corresponding Timestamp are stored in Elasticsearch)
Jan 30,14:49:56.785 INFO Plane 1A landed
Jan 30,14:49:57.099 INFO Plane 2B landed
Jan 30,14:49:57.368 INFO Plane 2C landed
Jan 30,14:49:57.620 INFO Plane 2D landed
Jan 30,14:49:57.900 INFO Plane 5X landed
Jan 30,14:49:58.267 INFO Plane 6G landed
I need moving average for every 3rd flight that lands.
y-axis : [3 / (Timestamp(2C) - Timestamp(1A)), 3 / (Timestamp(2D) - Timestamp(2B)), 3 / (Timestamp(5X) - Timestamp(2C))]
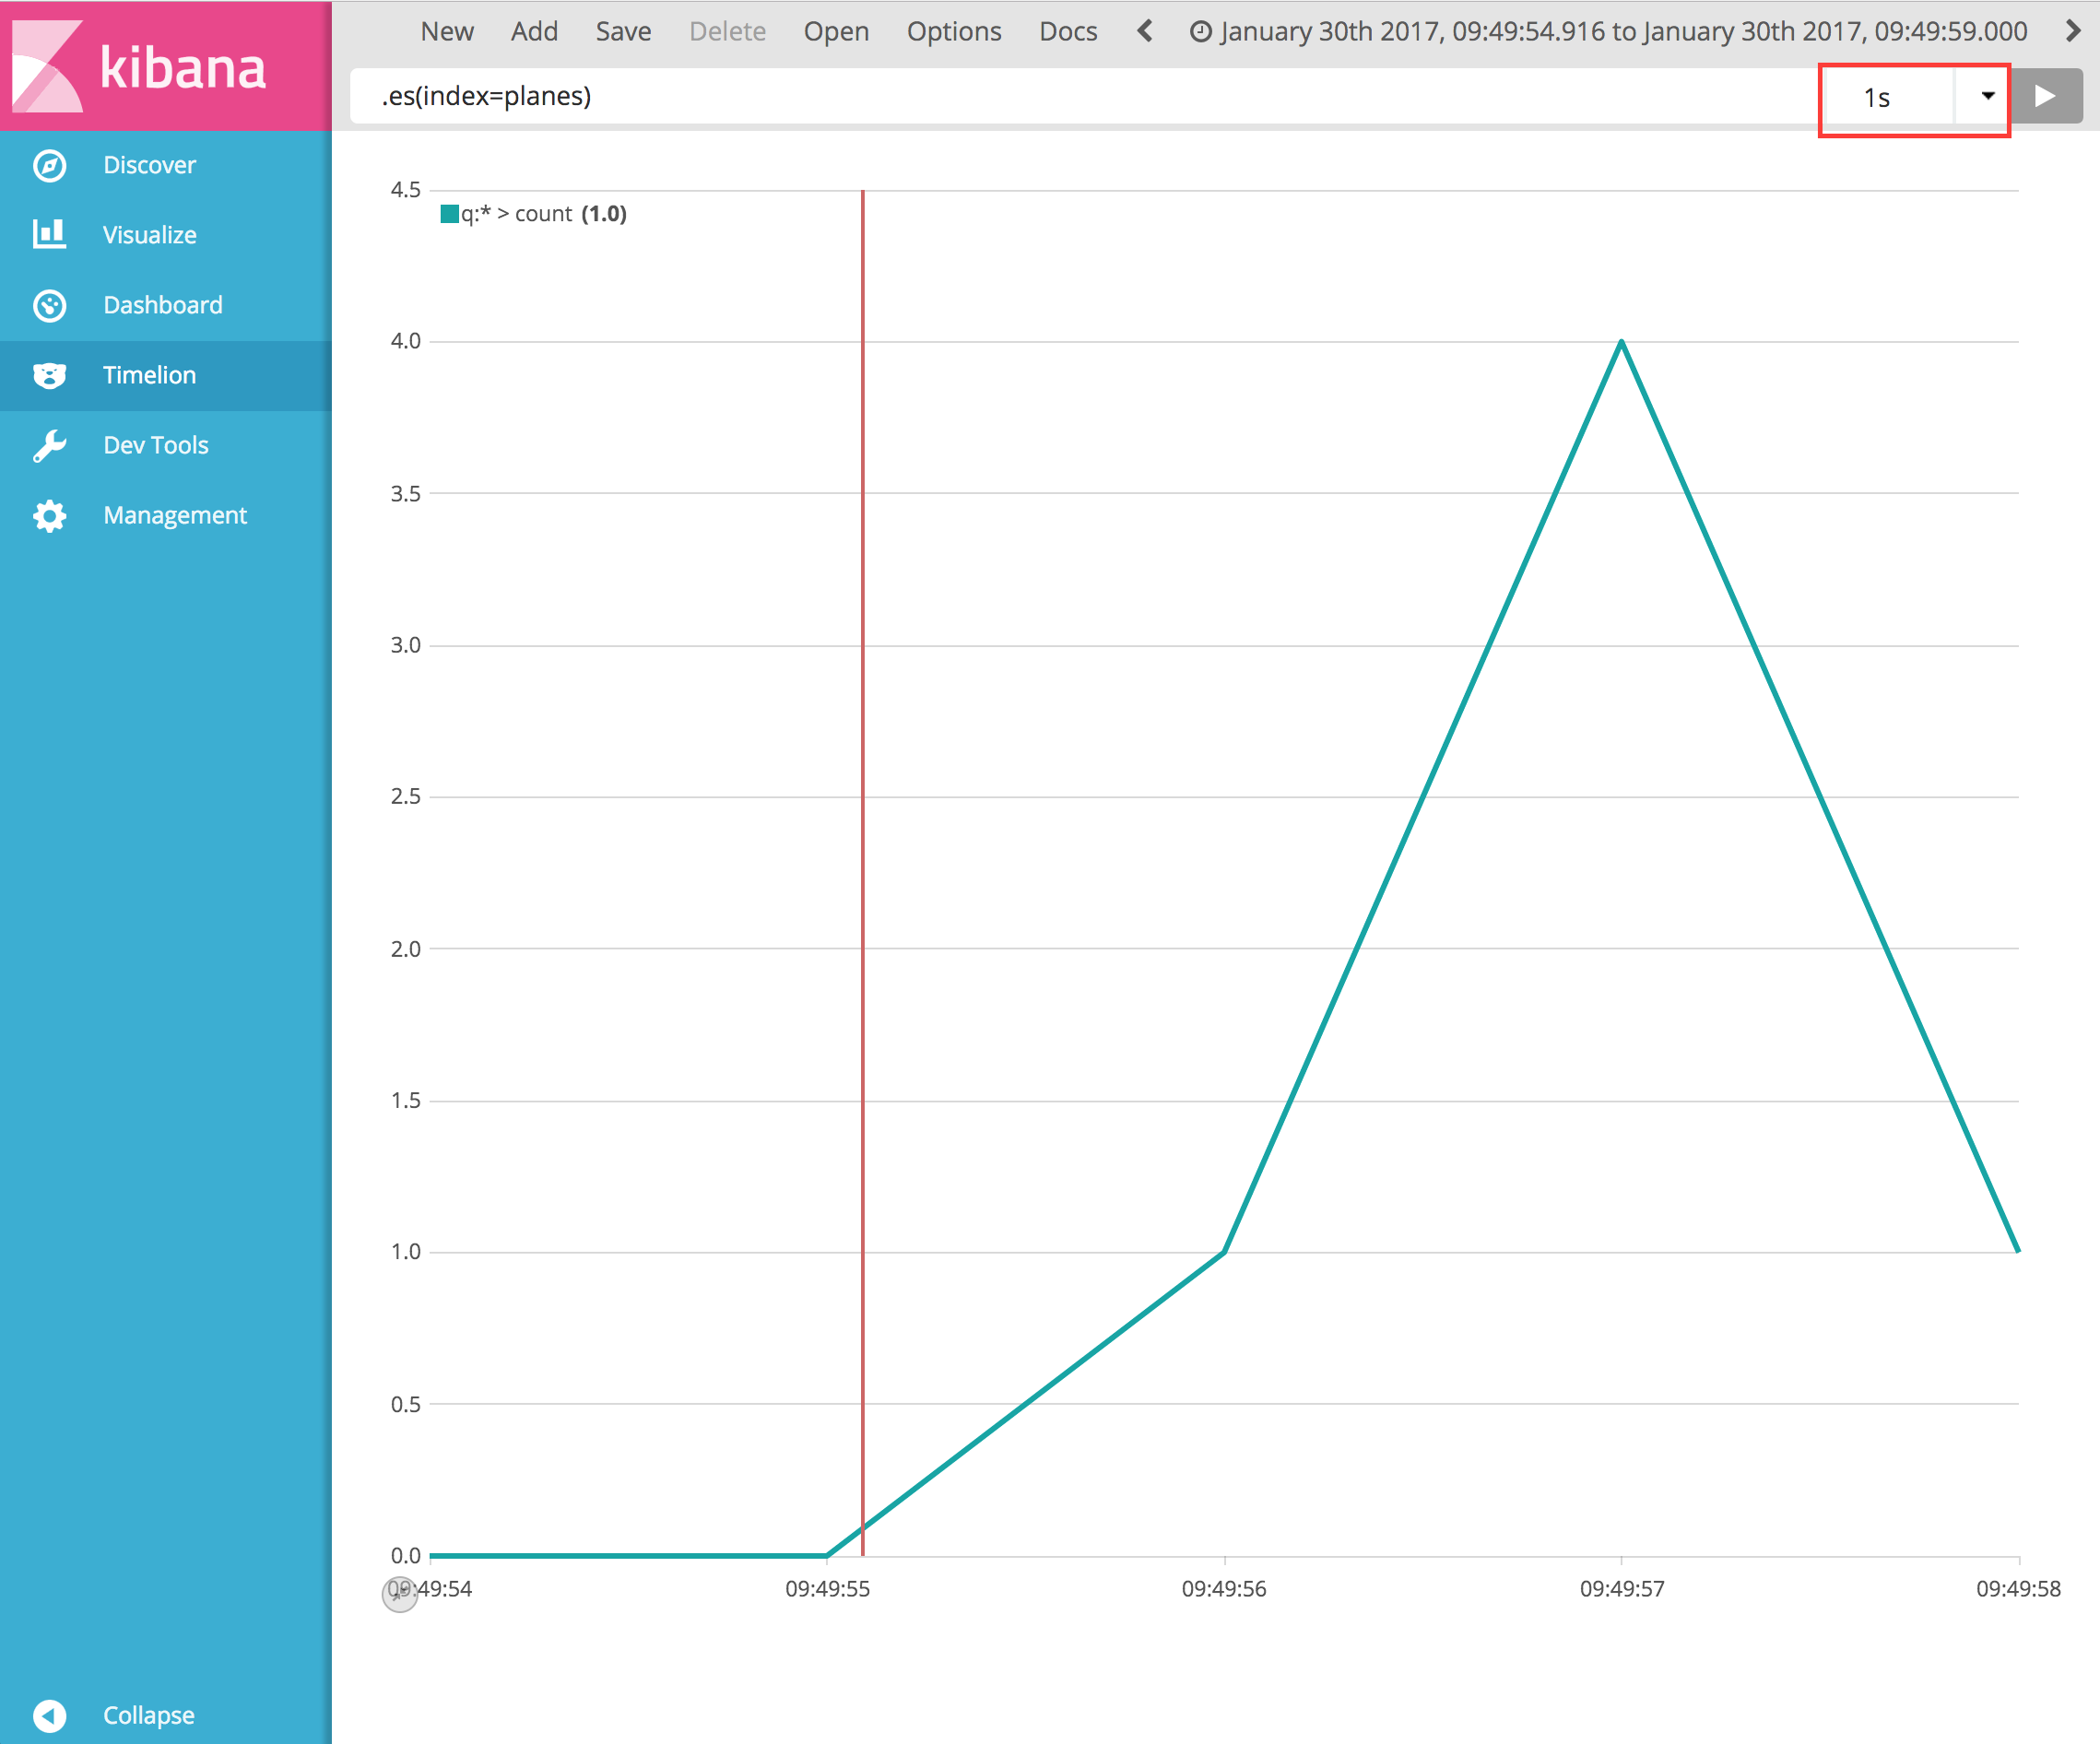
I tried this:
.es(metric='max:LandingTime').movingaverage(3)
But seems like it gives some other plot (may be 3 seconds or minutes, I'm not sure)
1.How can I achieve this graph?
2.Is timelion the right choice or it is not suitable in this case, any better suggestions?
3.Can X axis be something other than timestamp (ex: difference between time at which the first flight landed and the current flight)
Can somebody help please, stuck at this place from long time without solution. Thanks.
Regards,
Ruthu