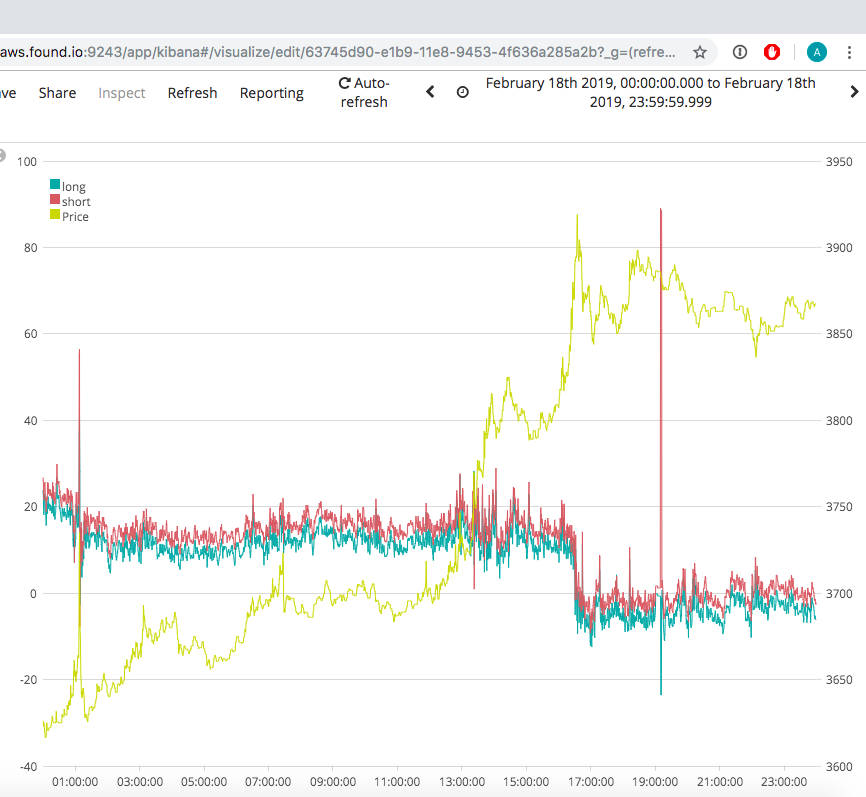
I've created a timelion series that shows a full graph when the date/time filter at the top right corner is set to 24 hours or less. However, when it's set to 7 days or more the data is patchy and only showing bits of lines but when I zoom into the blank areas by dragging the curser over the area it will show me a completed line graph (no blank/patchy areas) for that zoomed in period.
I've tried researching online but it doesn't seem like anyone has had this issue. Would anyone be able to explain why this is the case?
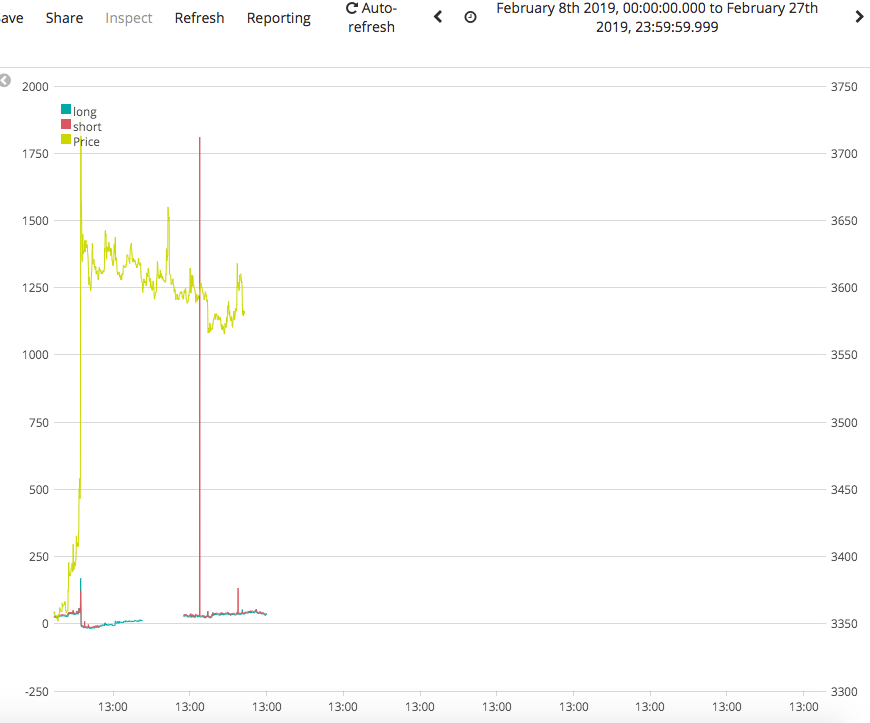
Please see attached images of the timelion graph. As you can see, if I do a selected interval of 60 days, the data is patchy and missing data and as you can see where my curser (red line) is at on the 60 day graph, there is no data for 18 Feb 2019, however if I zoom into this date there is a full graph and data showing for this date/period.
I have also attached a 4th screenshot with a small interval of 60 days but larger than 7 days to show the patchy graph.
Hi Nick, my interval setting is on auto and i am not getting any errors on any of the selected periods besides a patchy graph for a period greater than a couple days. If I change my interval to 1s I will receive the following error message: 'Max buckets exceeded; 604800 of 4000 allowed. Choose a larger interval or a shorter time span'. However, if i select 1d interval on a 7 day period it will give me a full graph but if i then change the period to 30 days, it becomes patchy again with no error message. I believe I am using Elasticsearch v6.5.1 and Kibana v6.4.3
Apache, Apache Lucene, Apache Hadoop, Hadoop, HDFS and the yellow elephant
logo are trademarks of the
Apache Software Foundation
in the United States and/or other countries.