Using Elastic Cloud with 7.6.2, Kibana 7.6.2.
I've got time series data as follows. One component generates a variety of messages. I have a panel filter that selects the component, then two visualizations that subdivide the data for presentation.
What I have found is that for a given time period, if one of the two visualizations has no documents found, the display of the other visualization will not appear.
Below are examples, and the visualization JSON associated with this visualization.
- 6.7 example of TSVB over 4 hours (running on AWS ES, works)
- 6.7 example of TSVB over 30 minutes (running on AWS ES, works)
- 7.6 example of TSVB over one hour (Elastic Cloud, works)
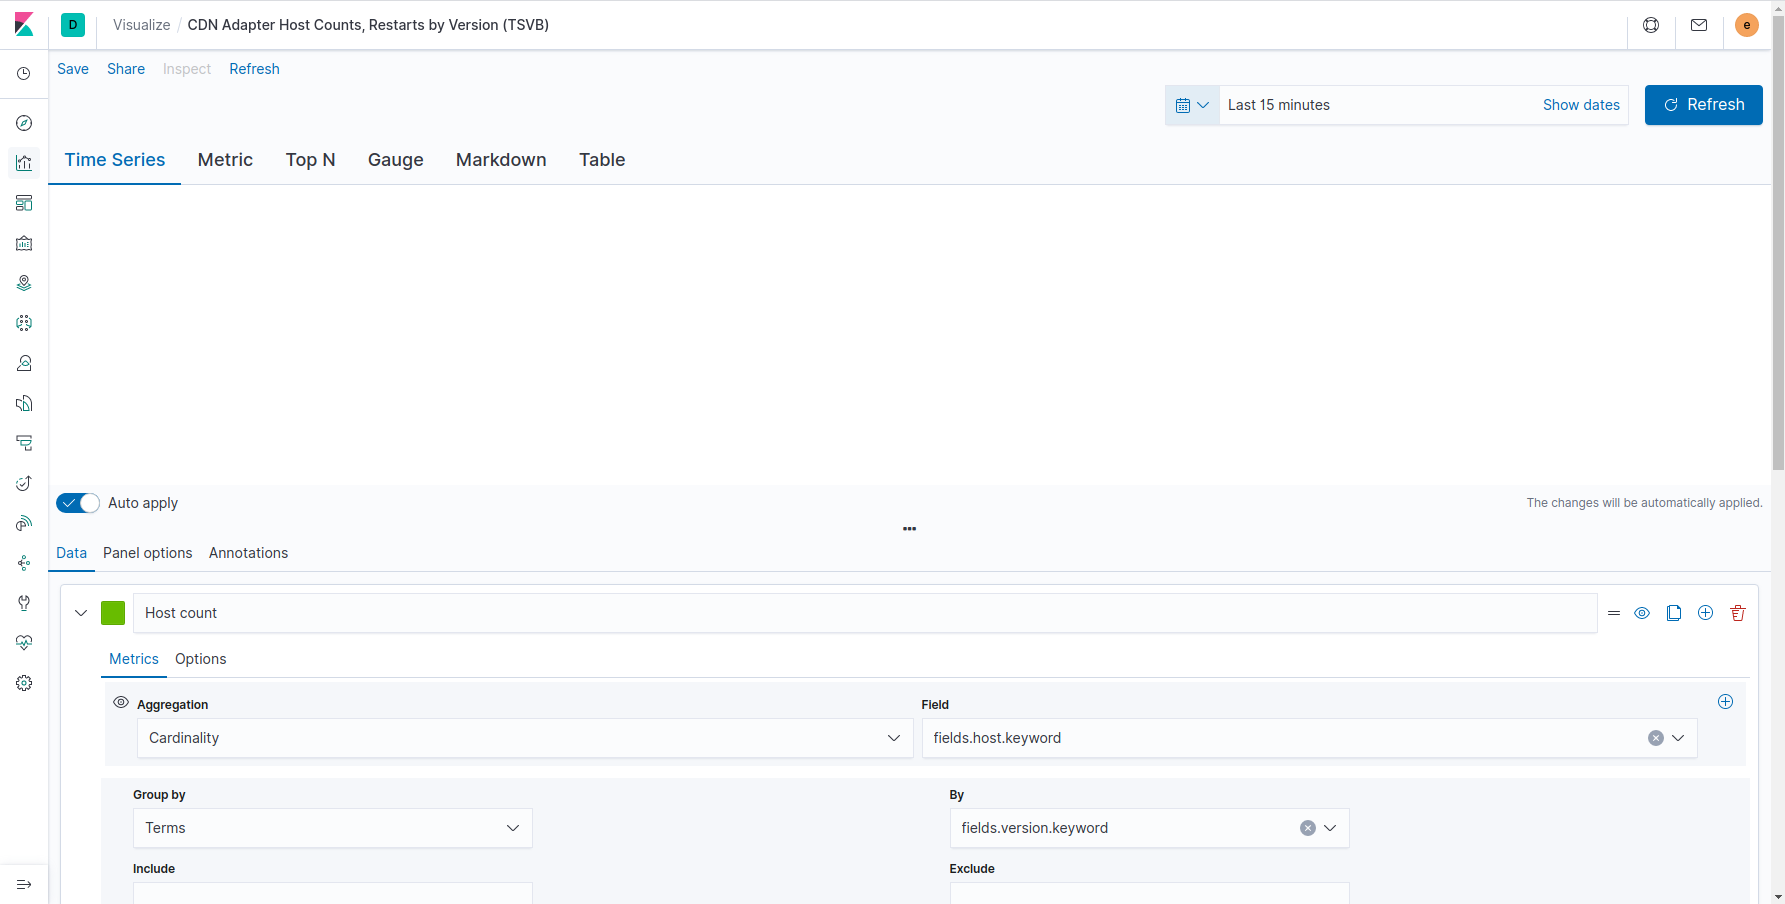
- 7.6 example of TSVB over 15 minutes (Elastic Cloud, illustrates problem)


  {
  "title": "CDN Adapter Host Counts, Restarts by Version (TSVB)",
  "type": "metrics",
  "params": {
    "id": "61ca57f0-469d-11e7-af02-69e470af7417",
    "type": "timeseries",
    "series": [
      {
        "id": "61ca57f1-469d-11e7-af02-69e470af7417",
        "color": "#68BC00",
        "split_mode": "terms",
        "metrics": [
          {
            "id": "61ca57f2-469d-11e7-af02-69e470af7417",
            "type": "cardinality",
            "field": "fields.host.keyword"
          }
        ],
        "separate_axis": 0,
        "axis_position": "right",
        "formatter": "number",
        "chart_type": "line",
        "line_width": 1,
        "point_size": 1,
        "fill": "0",
        "stacked": "none",
        "label": "Host count",
        "terms_field": "fields.version.keyword",
        "split_color_mode": "gradient",
        "value_template": "Hosts {{value}}"
      },
      {
        "id": "85079d80-5ff0-11ea-8dab-1bd437b3194e",
        "color": "rgba(188,0,19,1)",
        "split_mode": "terms",
        "metrics": [
          {
            "id": "85079d81-5ff0-11ea-8dab-1bd437b3194e",
            "type": "count"
          }
        ],
        "separate_axis": 1,
        "axis_position": "right",
        "formatter": "number",
        "chart_type": "line",
        "line_width": 1,
        "point_size": 1,
        "fill": "0",
        "stacked": "none",
        "label": "Restart Counts by Version",
        "terms_field": "fields.version.keyword",
        "filter": "message:start",
        "value_template": "Restarts {{value}}"
      }
    ],
    "time_field": "timestamp",
    "index_pattern": "",
    "interval": "auto",
    "axis_position": "left",
    "axis_formatter": "number",
    "axis_scale": "normal",
    "show_legend": 1,
    "show_grid": 1,
    "default_index_pattern": "logs-*",
    "filter": "fields.name:cdnadapter"
  },
  "aggs": []
}