I'm trying create dashboard which will allow users to compare two, the same graphs showing hourly jobs distribution break down by date.
The goal is to apply two, different dates on each graph using controls - I know I can do it manually on each visual, but this is no go scenario.
Tried to place the same data in to separate indexes, data views - trick with ignore filters and lucene OR filter did not help me as well.
Do you guys have any ideas on how I could tackle it?
Welcome back! Can you confirm which version of Kibana you are using, which visualization type you are using (Lens or other) and why the manual approach is a no-go option?
I'm using Lens as visualization type, but it is not a must - I can recreate it to any other type if needed. We are currently on Kibana v 8.18.2
I simplified description of my case to maximum, just to make it as clear as possible. Target solution will contain 6 different visuals per both: baseline and reference date. Number of visuals implicates 12, different manipulations which would be over complicated for non technical recipients of the dashboard - that is why it is no go scenario in this case
Thanks @Tortoise, unfortunately proposed solution won't solve my issue either.
My aim was to use controls - one on a "baseline" date field from index a, second on reference date field from index b. Sets of visuals are exactly the same, I would like to see baseline data on one set and reference data on the other one.
Tried many different things already including ignore filters, switching from kql to lucene combining / splitting data in indexes / data views etc.
Without success so far.
Have you considered a custom visualization using Vega if @Tortoise's suggestion or having separate visualization controls are no-go options ? That way you have full control over the visualization and can in fact have custom event handling interactions.
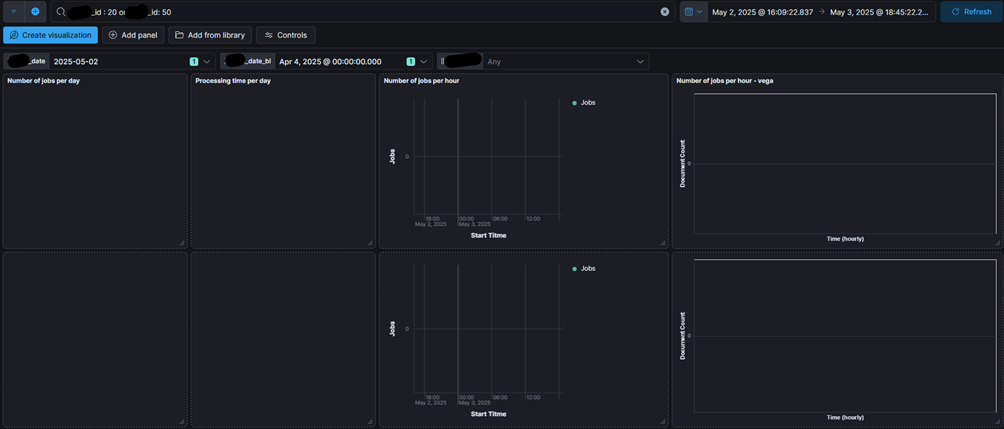
First 3 visuals from right are lenses, next one is vega, filtered by x_id: 20 in kql.
Bottom visualizations contains the same set of fields, but with "_bl" suffix and are filtered by x_id: 50. I can store both data sets in the same or different indexes if needed - tried both options + ignore filters with different scenarios.
When I'm choosing dates from both controls, all visual elements are empty, even though data is ingested:
If my understanding is correct , your are looking for a dashboard with below logic -
example : on a single dashboard you need 2 controls (date1 , date2) there will be 2 views (view1 , view2) can be many more views
date1 > view1
date2 > view2
So date1 changes should only impact view1 & no impact on view2 similarly for date2?
Hello @Tortoise
Yes, this my scenario - two views, each with separate control:
date1 > view1
date2 > view2
date1 changes should only impact view1 & no impact on view2 similarly for date2 - correct.
There will be only two views in my case
I tried to create 2 indexes A , B copy of say index C.
In A i renamed 1 field response-a & in B to response-b
Created 2 lens from separate dataviews (separate indexes/fields)
Added 2 different controls to filter response-a for A & response-b for B
When we filter on1 view say A below are the observations :
It filters at dashboard level & will show data in view A but as same field in not present in view B that will be shown blank
If the field is present in both the views than it apply filters for both the view.
Can we add drilldown to the individual views? by this it will redirect to discover/dashboard meant for that particular index only.
Or maybe complete dashboard in Vega as suggested by @carly.richmond
Thanks for verifying my case. It seems like it behaves exactly the same way as on my environment.
Goal is to have visual comparison of processing batches during to different days, so drilldown won’t solve the issue.
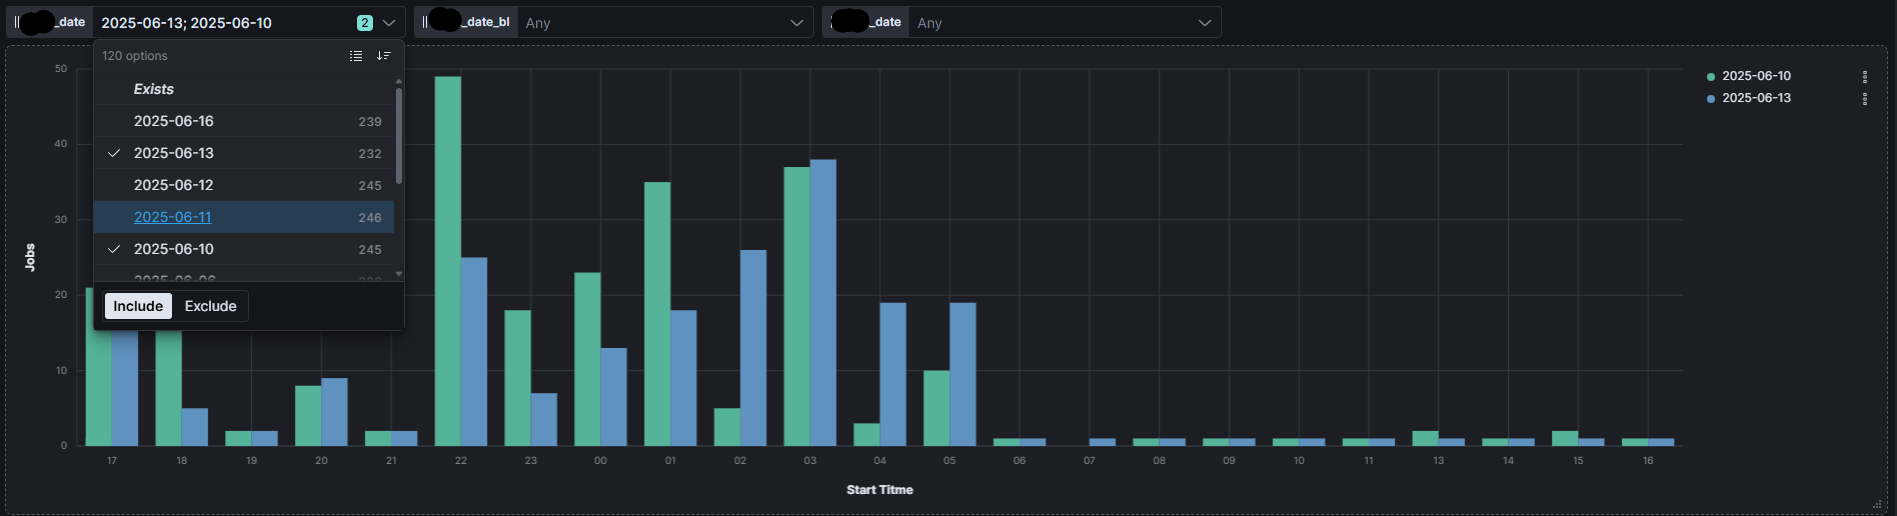
For now, I have two visuals written in Vega but placed next to lens graphs. Vega visuals reacts to controls exactly as lenses. I could of course rewrite everything in Vega, if you suggest it could solve my case.
I’m also thinking about calculating number of seconds from midnight (x axis) and store this value in the field. Then I would count nr of documents over 3600 sec / 1h. I could use one control, with multiple choices, for two different dates and visualize it in Vega as bar chart, on one visualization.
As a last resort, users will have to use two, browser windows, but for obvious reasons I’d like to avoid this solution
My dashboard consists of two vega visuals and two controls:
Control 1, field X_date -> View, vega 1 / X1 index
Control 2, field X_date_bl -> View, vega 2 / X2 index
Apache, Apache Lucene, Apache Hadoop, Hadoop, HDFS and the yellow elephant
logo are trademarks of the
Apache Software Foundation
in the United States and/or other countries.