Unable to create filebeat-* index pattern in kibana 7.11 after running filebeat

I can see the filebeat index. I go to make an index pattern with @timestamp and it just won't complete. The logs are clean on ES and Kibana.

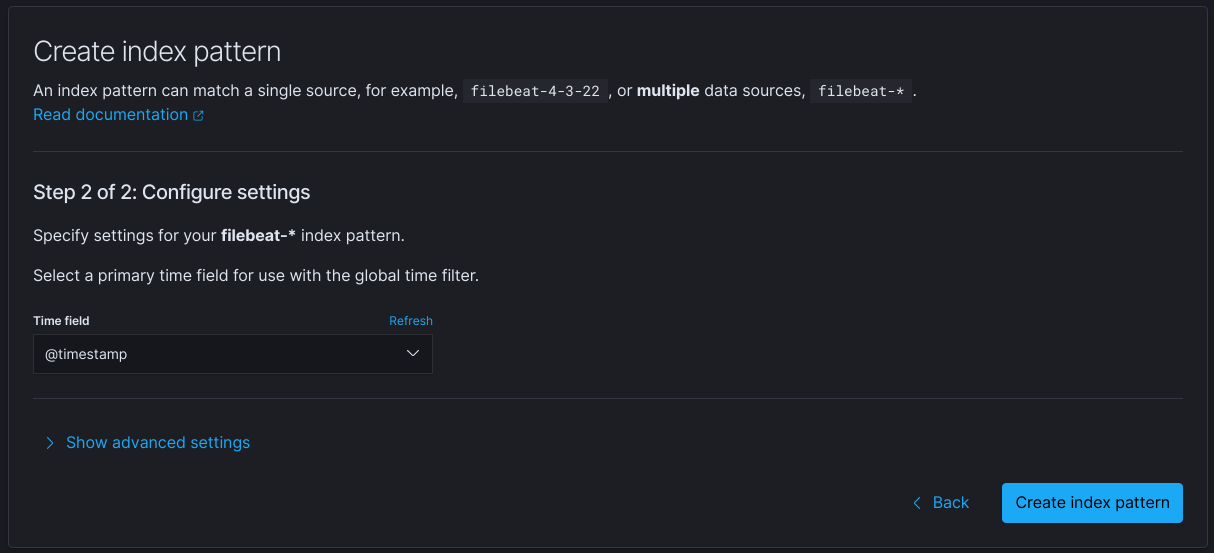
So yeah I click Create Index pattern and It just goes to the spinny thing and then back here
Like I said the logs are clean. I check the Kibana logs and all I can see is 200 return codes.
And ES has nothing in the logs.

I'm a bit stumped, please send help!

Oh and also even if I say "I don't want to use the time filter" it still doesn't work.

Hi @Malcolm_Haak welcome to the community!

Did you run filebeat setup that should have created the index pattern for you. You should have run setup before you started filebeat for the first time.

Note this does not answer why you cannot create it though but I'm curious?

Did you enable modules?

I'm on k8s, using the filebeat template from the manual:

I had to edit it to add nodes to the RBAC.

I did edit the config map to do the filebeat setup and it gave weird 500 errors. They looked like they came from ES not kibana.

But the ES and Kibana logs remained clean.

I looked at doing it via command line, but I can't find doco on how to tell it what my user/pass and kibana host name are.

Modules? In filebeat? It's all auto-configure

    apiVersion: v1
    kind: ConfigMap
    metadata:
      name: filebeat-config
      labels:
    k8s-app: filebeat
    data:
      filebeat.yml: |-
    filebeat.autodiscover:
      providers:
        - type: kubernetes
          node: ${NODE_NAME}
          hints.enabled: true
          hints.default_config:
            type: container
            paths:
              - /var/log/containers/*${data.kubernetes.container.id}.log

    processors:
      - add_cloud_metadata:
      - add_host_metadata:


    output.elasticsearch:
      hosts: ['${ELASTICSEARCH_HOST}:${ELASTICSEARCH_PORT}']
      username: ${ELASTICSEARCH_USERNAME}
      password: ${ELASTICSEARCH_PASSWORD}

That's the filebeat config.

Oh and the filebeat index is there. Same with the alias.

It's just the index pattern I can't setup

Oh and one thing to make it even weirder, I did create one for logstash without issue last week.
It was the first one and I think it provided a helper because none existed at that point.

Also thanks for the kind welcome.

Interesting.. thanks ... I did not understand this was on K8s.

We will save modules for another time :slight_smile:

Just for grins I see you are trying filebeat* could you try filebeat-*

Can you show the screen before?

How long are you waiting it can a few seconds? But not too long

I'm doing filebeat-*

And it does the spinny thing and then dumps me back at the screen in the screen shot.

That's the full loop, if you will

Oh also I think the screenshots show I'm doing filebeat-* :stuck_out_tongue_winking_eye:

I've done both. I just realised I have screen shots of both variations :smiley:

Soo I have an idea

In the Kibana config spec.. set

server.maxPayloadBytes: 5242880

And redeploy Kibana. Let me know if it works, there may be a bug

Retry creating the index pattern

Kibana settings here

This can fix index patterns not loading some times

Unfortunately this just make the spinny thing hang around for less time :frowning:

I checked the inspection console... This looks relevent

Edit: I've reached my reply max for the day...

Everything else works.

Currently auth is oauth2-proxy + nginx + keycloak using a dedicated role for the proxy with es-security-runas-user header set by nginx.

My user is setup as superuser.

Literally everything else is working. But this could be a corner case you think?

EDIT2: Used kubectl to setup a proxy to bypass the ingress. Logged in with native kibana login. Got this. (And yes I checked that I had the config you asked for added.

So it seems this part doesn't work correctly when behind the nginx proxy. Possibly because the es-security-run-as user isn't getting set on the request, or because the payloads are too big.

I wonder if the ES payload is too big. I'm going to go look at my nginx logs.

But yeah I can't do any more posts for the day because this account is too new. So edits it is!

EDIT: Got it.
2021/02/19 05:25:17 [error] 13768#13768: *20811191 client intended to send too large body: 1050693 bytes, client: 10.42.29.0, server: elastic, request: "PUT /.kibana/_create/index-pattern%3Ad9b33250-7272-11eb-b224-9bfa5cf1c02a?refresh=wait_for HTTP/1.1", host: "elastic"

Edit: I just dropped the index's as they were already 3GB+ and attempted to create the index pattern when the new index was still only 5MB. It worked.

Yup that's not good....

What kind of auth did you set up?

Can you do / save anything in Kibana looks like there is some auth issue

Sorry not sure if you added all the auth stuff after I responded.

That's quite and auth setup ... Not my area of expertise...

Corner case.. doubtful ... Index patterns are pretty mainstream.

I will be setting a vanilla ECK + Filebeat tomorrow.

Tomorrow try to create a Visualization and save it... Curious if it works / fail.

Found the issue. It seems error messages and es_security-run-as-user aren't friends. So that's possibly a bug.

But yeah basically the size of the index was too large. Even increasing the allowed reply sizes to insane values didn't allow it to work . So yeah I flushed the indexes and just created it with a small index. And it worked fine.

Not sure if that's a bug tho. The index was 5GB so possibly.,

Good you got it solved, thanks for reporting back.

5GB for an index is pretty small, index pattern is really just about meta data about the index, field types etc so it in the mb, so not sure what happened.

This topic was automatically closed 28 days after the last reply. New replies are no longer allowed.