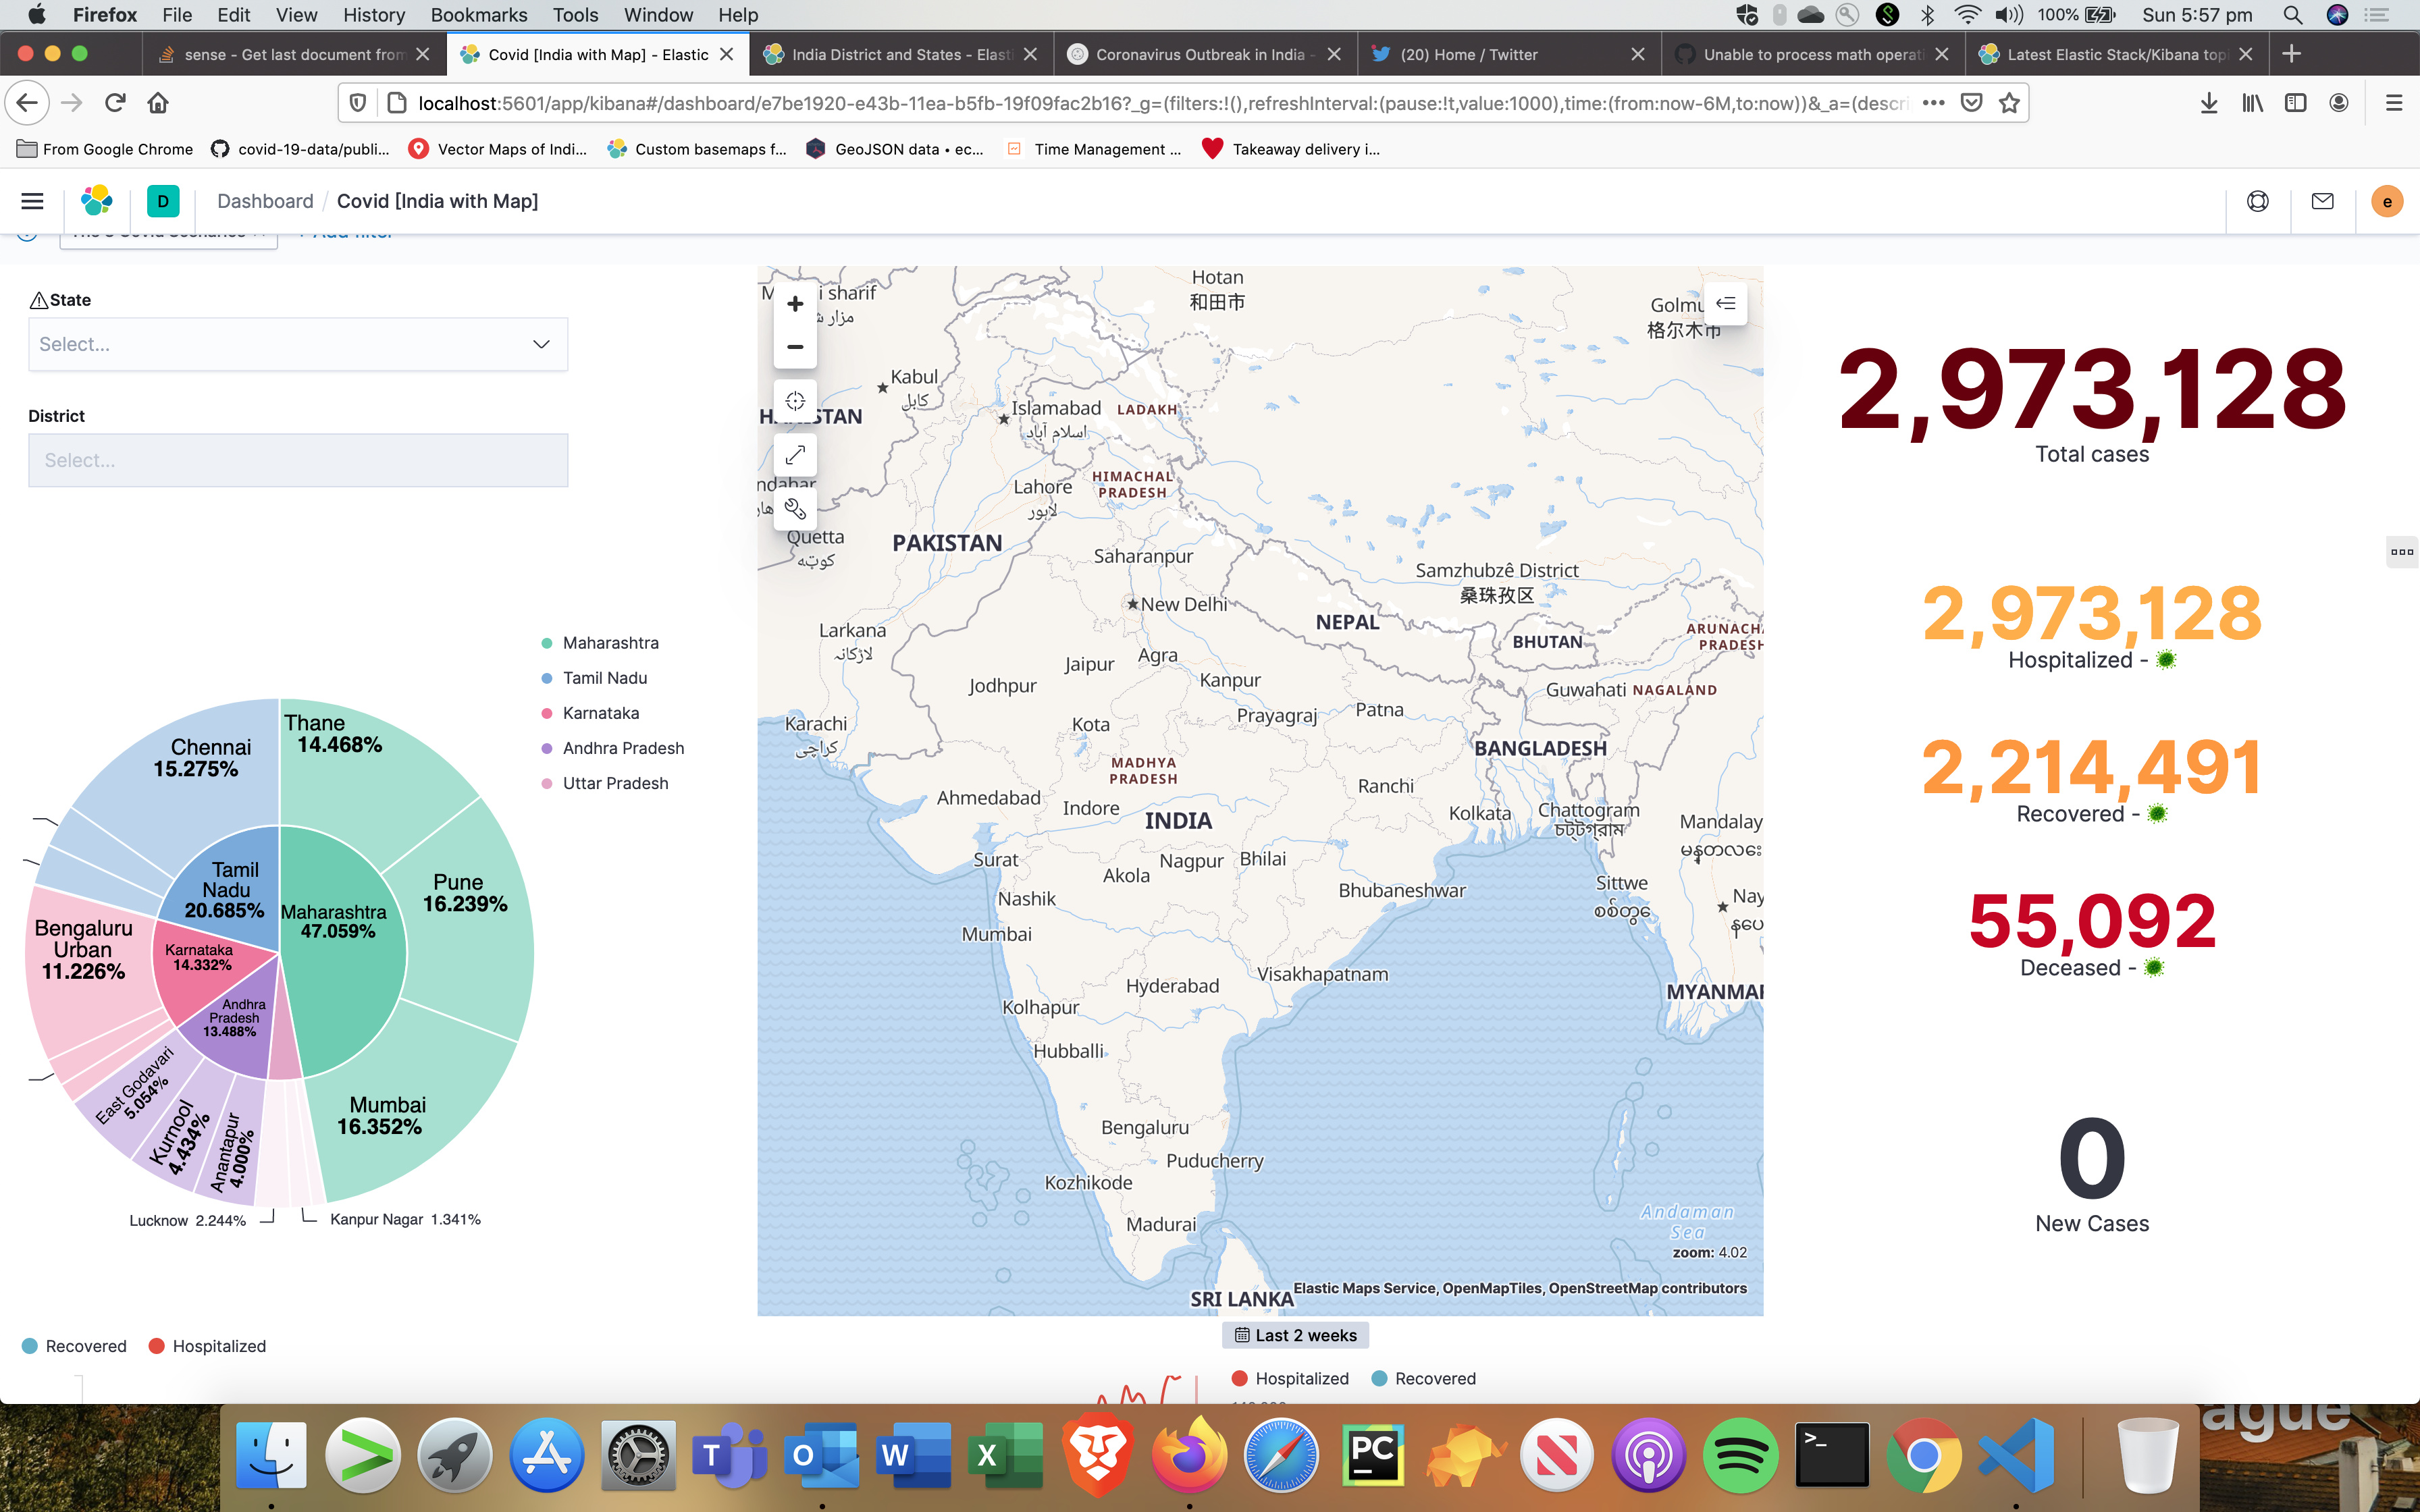
I have been able to create a map visualisation. But the tiles do not load when the map is put into a dashboard.
Visualisatuion :

In Dashboard:
Can someone help me ?
What is the time range on the dashboard? No polygons will be dispayed if there are no matching results.
Should this be the expected behavior?
I mean polygons should always be there irrespective of time. I feel the values should just keep updating based on time. I am very new to Kibana Maps.
I just check thed time range. They are both exactly same - last 6 months
The default behaviour is that only polygons with aggregated documents are rendered.
You can check this with the Kibana Flights sample dataset, making a choropleth map of the DestCountry or the OriginCountry fields will only show polygons with aggregated data, not a full world map.
Sorry may be i did not get it right. So the polygons was populated using a geojson file (no timestamp) . The chloropleth is produced by joining the idex of the geoJSON data and another index (used to populate the dashboard). The map itself works fine but doesnt work on the dashboard.
Am i doing it wrong ?
Can you try to uncheck this setting in your layer to prevent the global filter to be applied on it?

Awesome. It worked ! thanks 
Glad it worked 

© 2020. All Rights Reserved - Elasticsearch
Apache, Apache Lucene, Apache Hadoop, Hadoop, HDFS and the yellow elephant logo are trademarks of the Apache Software Foundation in the United States and/or other countries.