Hello,
I'm using an elasticsearch cluster (6.5.4) but I have a strange behaviour in management
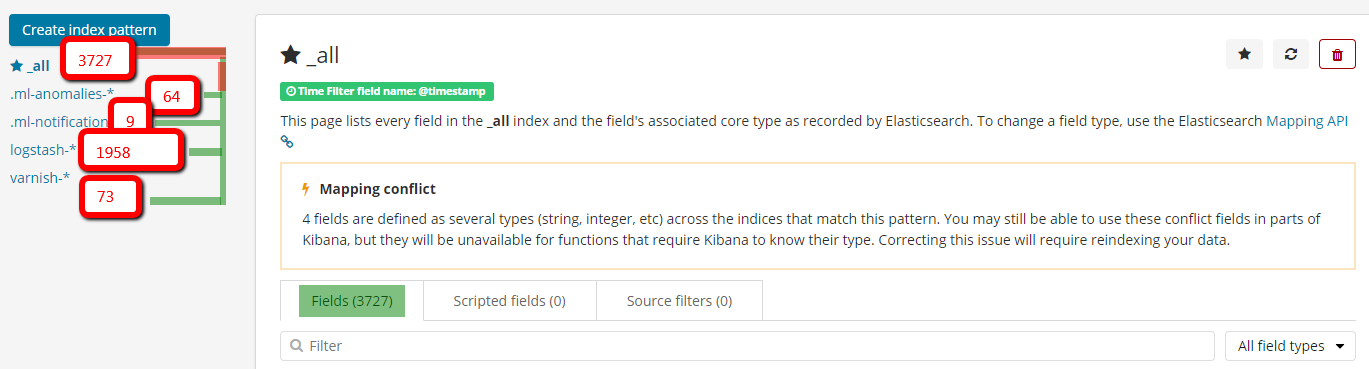
In this image we can see the sum of fields per index pattern is way lower than the one in _all (3727)
The issue I have is for a particular field, ctxt_executionTime it does not appear in available fields in visualize. I can't see it either in logstash-* index pattern, but only in _all.
I've refreshed field list several time but still not here.
But in discover mode I see it without the warning as a number and I can even filter it successfully
{
  "range": {
    "ctxt_executionTime": {
      "gte": 0,
      "lt": 1000000
    }
  }
}
I would like to be able to use it in visualize and also understand why this field is not in my 'logstash-*' pattern
Thanks and have a nice day 
Guillaume