If I would like to create an uptime alert with filtering only to certain monitor.name or monitor.type the filtering does not effects - all the monitors are checked and the alerts are fired.
In the result index (test1) the following document appeared. { "_index" : "test1", "_type" : "_doc", "_id" : "8BmianYBpUTboumd6Vw8", "_score" : 1.0, "_source" : { "alert_time" : "2020-12-16T07:57:29.303Z", "subject" : "test5", "to" : "email1@abcd.net", "message" : "Down monitor: jira_nginx-af274034a0a744e5" } }
So, it reports about a monitor that does not fitt in the filter.
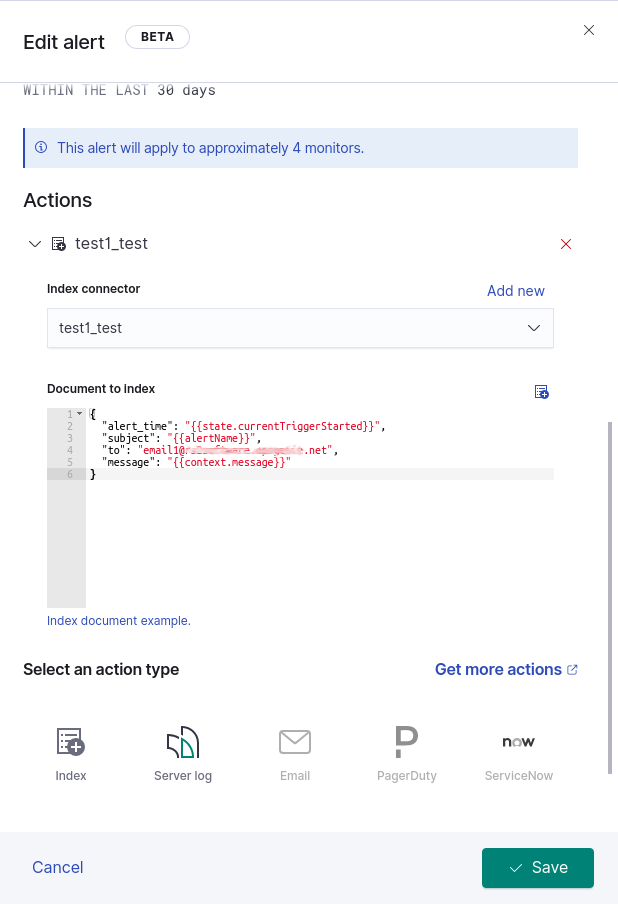
I just spent a while trying to reproduce this, but wasn't able to. Would you be able to navigate to the alert management page and show the list of instances for your alert? It should look like the screenshot below. I'm wondering, could you have multiple alerts setup, and be looking at the output of another alert with broader criteria?
Apache, Apache Lucene, Apache Hadoop, Hadoop, HDFS and the yellow elephant
logo are trademarks of the
Apache Software Foundation
in the United States and/or other countries.