Is is possible to link an existing monitor to a agent that is enrolled in fleet?
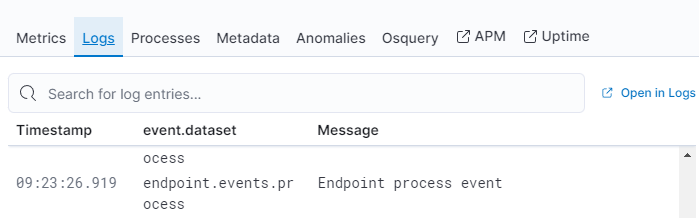
When you go to Uptime then metrics explorer you get a nice overlay but clicking view in Uptime ends with the main Uptime page and not the agent status.
Obviously fake data but let say I have Fleet and the agent is running I now have displayname sending it's data and a monitor for displaydata as well. They are 2 separate entities. Could I use Host ID from Agent to represent the ID?
2nd part which would play into part 1. Not all services are web based/tcp nor can they have modules installed "pre packaged binary files from vendors". With a linked ID could we add windows.service.name = state? so we can look for services without said options. This would be a huge help then having to have hundreds of query's for services state where a linked ID would take care of it.
Can you please describe the problem in detail with help of screenshots, we are confused , how you want to link an uptime monitor to elastic agent, do you mean from the metrics explorer app?
Or are you talking about fleet integration generated uptime monitors?
Bingo. That's what I'm after but a more manual option step. I could care less if a workstation go offline so doing this automatically isn't ideal in all cases.
For example in metric-* you have a field called "elastic_agent.id" or you could use "agent.ephemeral_id"
At this point it pulls you to the main page with all monitors on it. Not to the individual monitor that I would expect to to link to. It's not helpful at all to go to the main page as I'm looking for 1 specific monitor. I have 290 separate ones that are already in use and growing. It would be very nice to be able to link them for a 1 click to check the uptime. This would also be able to add far more to the metrics tab as you would be able to pull in the uptime for services into metrics as well depending on what is in the monitor.
From that point when your in inventory looking at a single machine.
You would be able to have Uptime directly on the same page vs having to jump between two tabs to see what is going on. A host missed a few check in's and the CPU and Memory and Network was at 100% at the same time on the same page.
This could also lay the ground work to make Uptime and Metric far more useful. ATM sorry to say it's the one tab I don't care to look at. It's better to take the 30 minutes and build out a dashboard with everything I mentioned. With a linked ID you would also have all the services that are running on a specific machine and ideally you could have Uptime alert on specific ones that are not tcp or icmp but actual windows servers. I have hundreds of services that Elastic simply can't monitor with Uptime and have no tcp connections that run to them.
Hopefully that made sense. Think Sol__winds or maybe Wh_tsUpG___. Limited names so search engines don't catch them.
Apache, Apache Lucene, Apache Hadoop, Hadoop, HDFS and the yellow elephant
logo are trademarks of the
Apache Software Foundation
in the United States and/or other countries.