Hi
I am using ELK 7.2. I have configured kibana to monitor number of users hitting our internal environments on both windows and linux.
The issue am having here is.
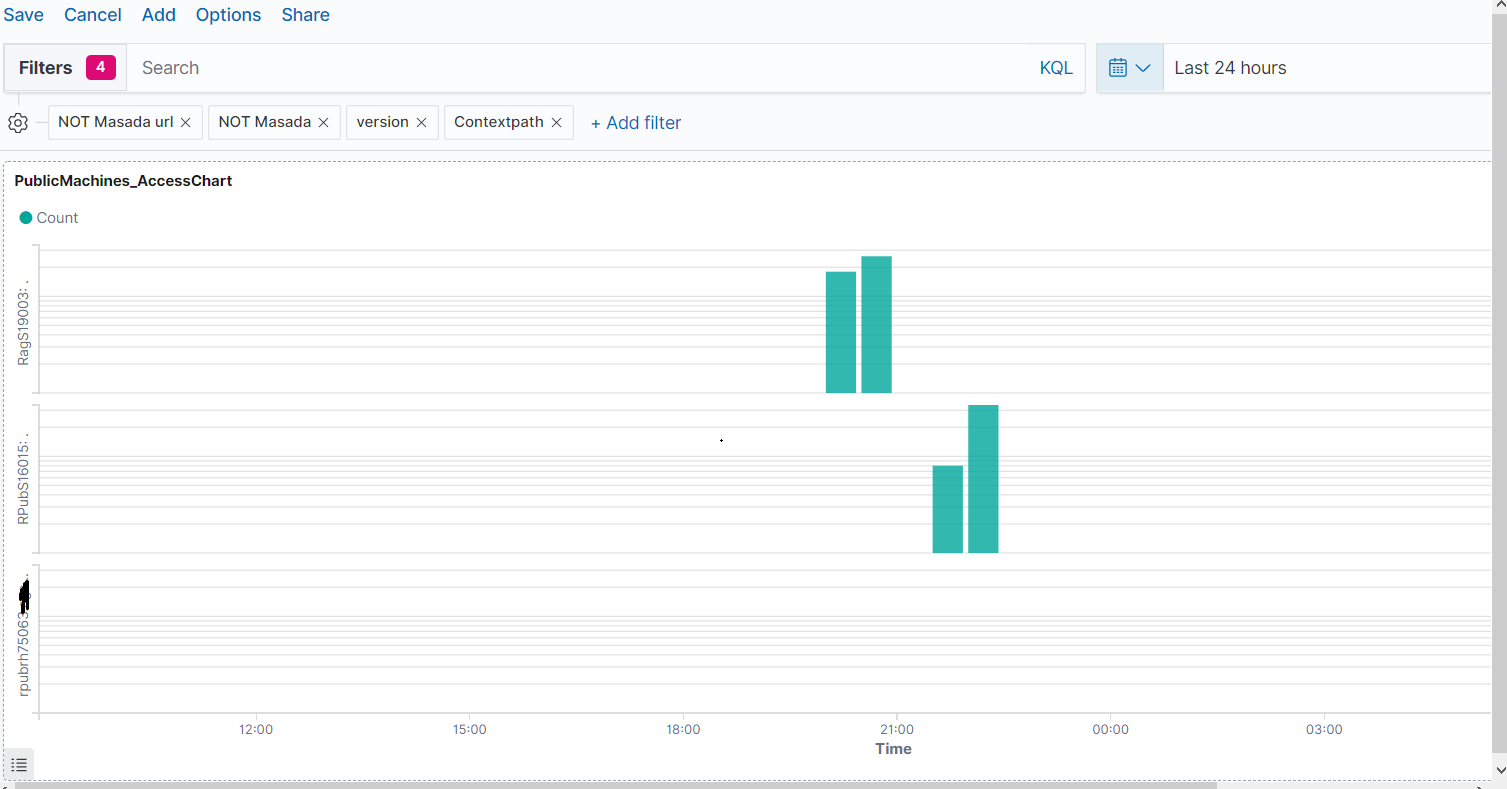
if I set the time frame to see all the environments hit in last 1 hour I see two servers in the list as you see in the image you can see (75063 and 75067).
But when I change the time frame to 24 hours. I see a different server in the list and I dont see the server names which I got in last 1 hours which is not correct. If I choose 24 hours it must show those server names as well which come in 1 hour interval.
Here I don't see (75067) which I saw in the previous graph for last 1 hour interval.
Please correct me what's wrong in my configuration. Below is my configuration for the graph.

Metric & Axis
You terms aggregation is only returning the top host because Size is set to 1. Terms aggregation will only return the top buckets as configured by size. When you expand your time range, then the buckets you get for a smaller time range may no longer be in the top buckets for the larger time range.
How many hosts do you have? Increase Size to that number if the number is not huge.
I have almost 200 hosts but I am adding filter to separate hosts per environment. So there will be 20 hosts per environment.
@Nathan_Reese
I changed it to some higher number still It doesn't work.
HI @Nathan_Reese Can you please help me. I am not seeing correct data on the graph.
I tried to see the count of users on different servers it showing as one server for last 24 hours.
But where as when I got to discover and tried to add the same filter it shows a different result as you see in the image.
Discover shows documents while visualize shows aggregated results. That is why you are seeing the difference. Maybe split your visualization by host?
@Nathan_Reese
I am splitting the chart by agent.hostname. Is this not the correct way. Can you please correct me.
@Stacey_Gammon Sorry to include you here. But can you please help me with this. I believe the bar graph is not showing the correct data.