Hi
Please help me with this specific issue as this is critical.
ELK 7.2
I am getting access logs data from both Apache and IIS logs and storing in filebeat-index.
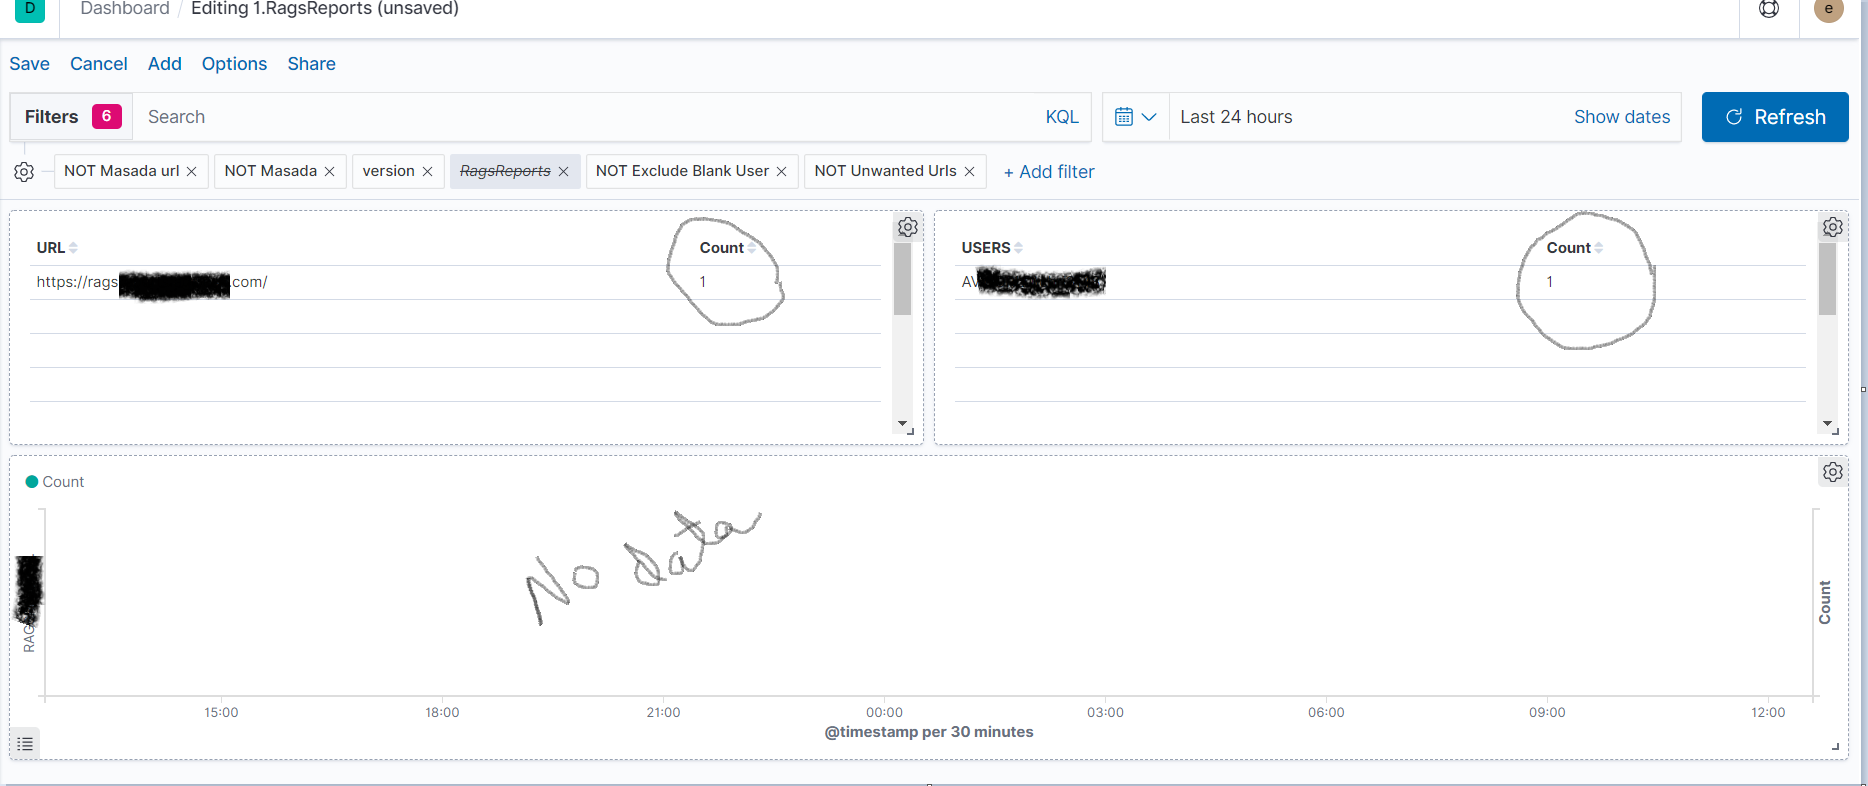
I am trying to create a bar graph to show number of hits made to our environments.
I have divided servers in to a groups using fields.env: field.
When I create a bar graph and filter it per every environment the data shown on Graph is not accurate and missing some values.
For example.
I see an empty bargraph for 1 hour time for environment called "10.8"

At the same time when I look at discover tab I see different results. I see count as 20.
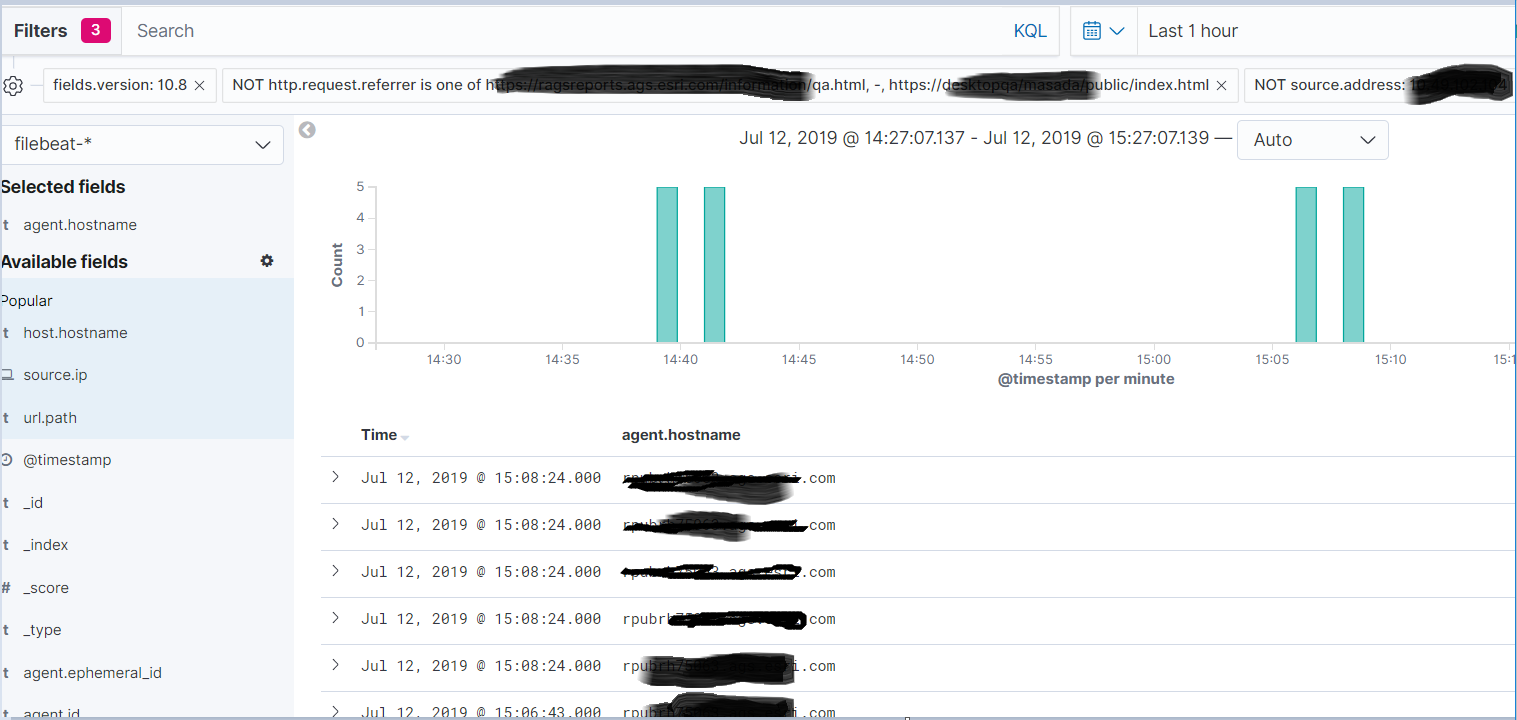
I see similar discrepencies in the graph. Please tell me how I can properly configure this.
Below is my configuration.